## Bar Chart: MR-Scores of Models on Different Difficulty Levels
### Overview
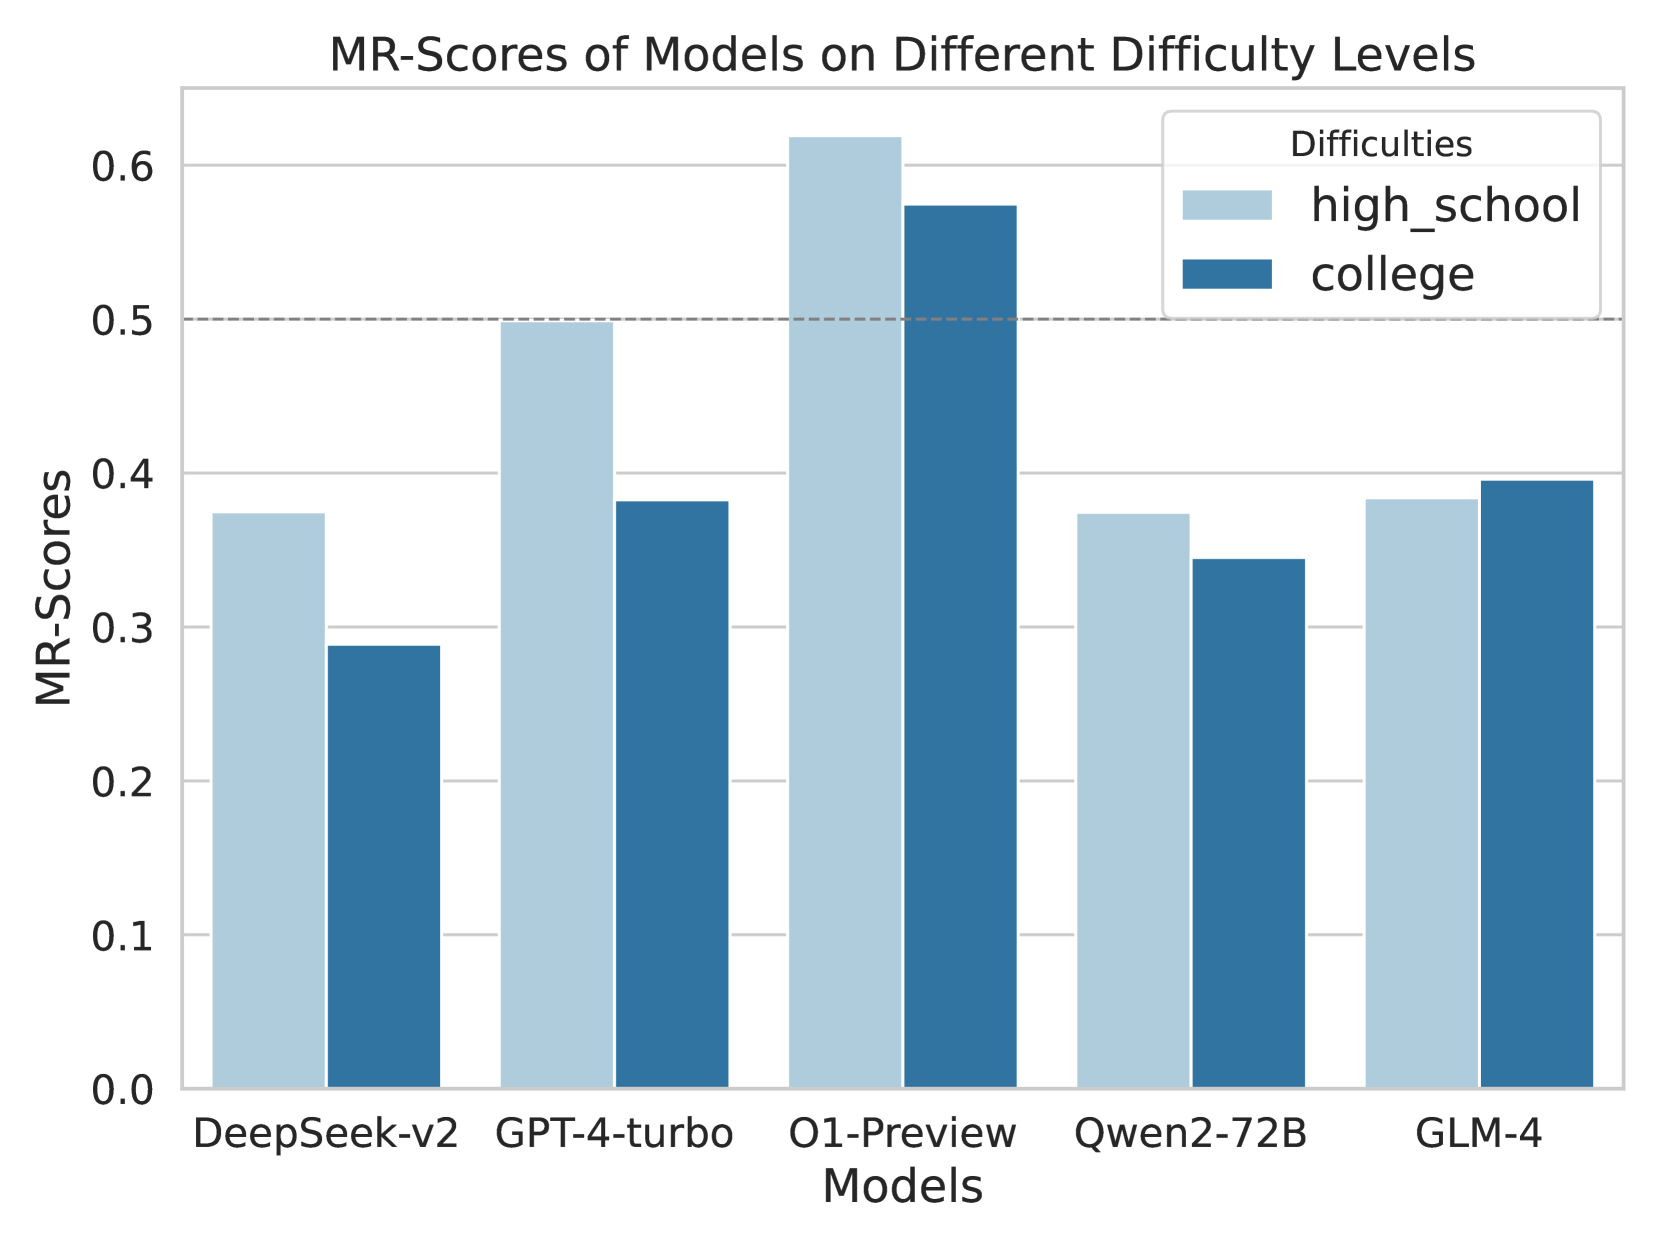
This image is a grouped bar chart comparing the performance of five different artificial intelligence models based on a metric called "MR-Scores." The performance is evaluated across two distinct difficulty levels: "high_school" and "college."
*Language Declaration:* All text in this image is in English. No other languages are present.
### Components/Axes
**Header Region:**
* **Chart Title:** "MR-Scores of Models on Different Difficulty Levels" (Centered at the top).
**Main Chart Region:**
* **Y-axis:**
* **Title:** "MR-Scores" (Rotated 90 degrees counter-clockwise, positioned on the left).
* **Scale/Markers:** Linear scale starting from 0.0 to 0.6, with increments of 0.1 (0.0, 0.1, 0.2, 0.3, 0.4, 0.5, 0.6).
* **Gridlines:** Solid light gray horizontal lines extend from each y-axis marker across the chart area.
* **Reference Line:** A distinct, horizontal dashed gray line is positioned exactly at the 0.5 mark on the y-axis.
* **Legend:**
* **Position:** Top-right corner of the chart area, enclosed in a white box with a light gray border.
* **Title:** "Difficulties"
* **Categories:**
* Light blue solid square = "high_school"
* Dark blue solid square = "college"
**Footer Region:**
* **X-axis:**
* **Title:** "Models" (Centered at the bottom).
* **Categories (Left to Right):** "DeepSeek-v2", "GPT-4-turbo", "O1-Preview", "Qwen2-72B", "GLM-4".
### Detailed Analysis
*Trend Verification & Spatial Grounding:* For each model on the x-axis, there is a pair of bars. The left bar is always light blue (representing `high_school`), and the right bar is always dark blue (representing `college`). Visually, the light blue bar is taller than the dark blue bar for four out of the five models, indicating higher scores on high school difficulty. The exception is GLM-4, where the dark blue bar is marginally taller.
Below are the extracted approximate values (±0.01 uncertainty) based on visual alignment with the y-axis gridlines:
**1. DeepSeek-v2**
* *Visual Trend:* The light blue bar is noticeably taller than the dark blue bar.
* `high_school` (Light Blue): ~0.37
* `college` (Dark Blue): ~0.29
**2. GPT-4-turbo**
* *Visual Trend:* The light blue bar touches the dashed reference line, while the dark blue bar is significantly lower.
* `high_school` (Light Blue): ~0.50 (Exactly on the dashed line)
* `college` (Dark Blue): ~0.38
**3. O1-Preview**
* *Visual Trend:* Both bars are the tallest in the chart, extending above the 0.5 dashed line. The light blue bar is taller than the dark blue bar.
* `high_school` (Light Blue): ~0.62
* `college` (Dark Blue): ~0.57
**4. Qwen2-72B**
* *Visual Trend:* The light blue bar is slightly taller than the dark blue bar. Both are below the 0.4 line.
* `high_school` (Light Blue): ~0.37
* `college` (Dark Blue): ~0.34
**5. GLM-4**
* *Visual Trend:* This is the only grouping where the dark blue bar is slightly taller than the light blue bar. Both sit just below the 0.4 line.
* `high_school` (Light Blue): ~0.38
* `college` (Dark Blue): ~0.39
### Key Observations
* **Top Performer:** "O1-Preview" significantly outperforms all other models in both difficulty categories, being the only model to score above 0.5 on the college-level difficulty.
* **General Difficulty Trend:** Four out of five models score higher on "high_school" tasks than on "college" tasks, which aligns with the expected progression of academic difficulty.
* **The Anomaly:** "GLM-4" is the only model that scores slightly higher on the "college" difficulty (~0.39) compared to the "high_school" difficulty (~0.38).
* **The 0.5 Threshold:** The explicit dashed line at 0.5 suggests this is a critical benchmark. Only "O1-Preview" (both levels) and "GPT-4-turbo" (high school level only) meet or exceed this threshold.
### Interpretation
The data demonstrates a comparative evaluation of Large Language Models (LLMs) on a specific reasoning or knowledge benchmark (MR-Scores).
The consistent drop in performance from "high_school" to "college" for almost all models indicates that the "college" dataset successfully introduces a higher degree of complexity that these models struggle to resolve.
The presence of the dashed line at 0.5 likely represents a "pass" rate, a 50% accuracy mark, or a baseline human-level performance metric. The fact that "O1-Preview" clears this line comfortably in both categories suggests a generational leap or a specific architectural advantage in reasoning capabilities compared to the other models tested (like GPT-4-turbo and DeepSeek-v2).
The anomaly with GLM-4 (scoring better on college than high school) is highly unusual. Reading between the lines, this could suggest a few possibilities:
1. The training data for GLM-4 was heavily skewed toward advanced academic texts, making it better at college-level phrasing.
2. The specific "high_school" prompts used in this test contained formatting or logic puzzles that GLM-4's architecture handles poorly compared to standard academic Q&A.
3. It is a statistical artifact due to a specific subset of questions in the benchmark.