\n
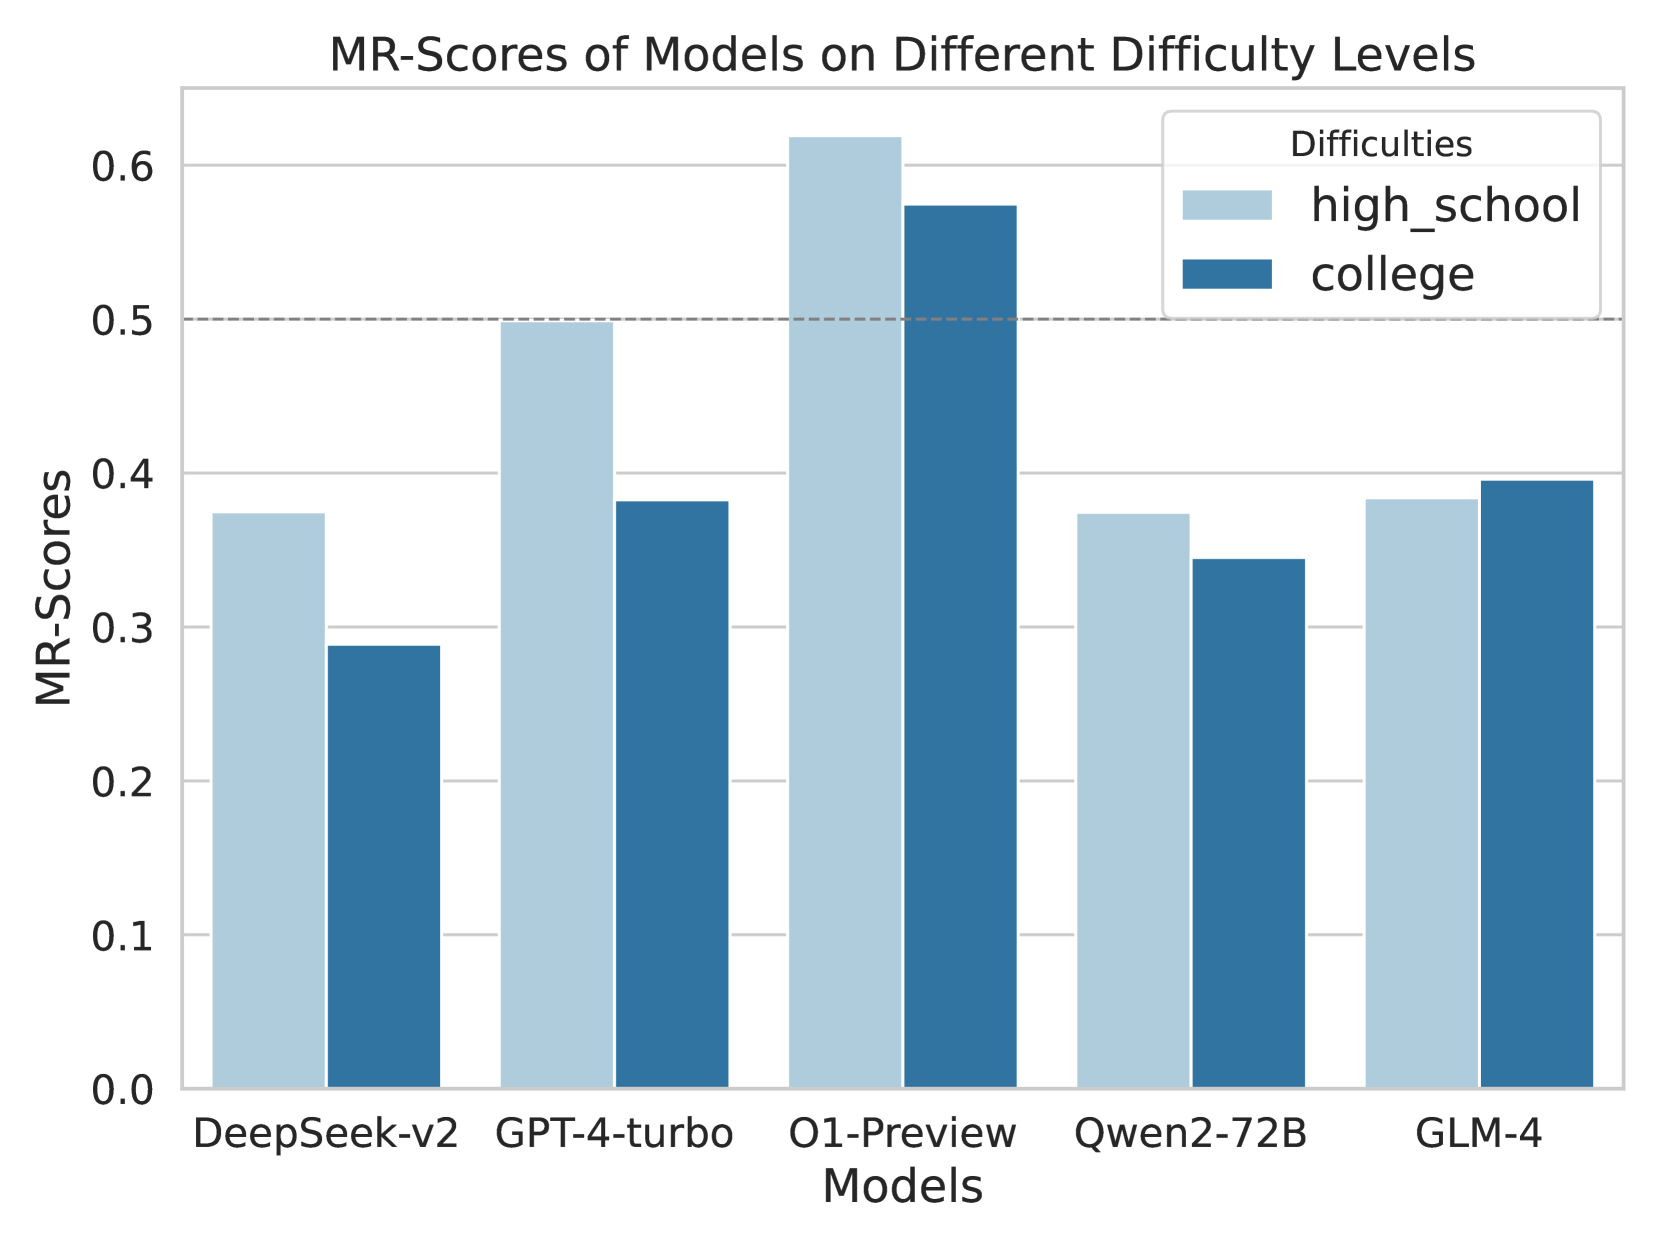
## Bar Chart: MR-Scores of Models on Different Difficulty Levels
### Overview
This bar chart compares the MR-Scores (presumably a metric of model performance) of five different models – DeepSeek-v2, GPT-4-turbo, O1-Preview, Qwen2-72B, and GLM-4 – across two difficulty levels: high school and college. Each model has two bars representing its score on each difficulty level.
### Components/Axes
* **Title:** "MR-Scores of Models on Different Difficulty Levels" (Top-center)
* **X-axis:** "Models" with markers: DeepSeek-v2, GPT-4-turbo, O1-Preview, Qwen2-72B, GLM-4.
* **Y-axis:** "MR-Scores" with a scale ranging from 0.0 to 0.6, incrementing by 0.1.
* **Legend:** Located in the top-right corner, labeled "Difficulties" with two entries:
* "high\_school" (Light Blue)
* "college" (Dark Blue)
### Detailed Analysis
The chart consists of paired bars for each model, representing the MR-Scores for high school and college difficulty levels.
* **DeepSeek-v2:**
* High School: Approximately 0.38 (Light Blue)
* College: Approximately 0.31 (Dark Blue)
* **GPT-4-turbo:**
* High School: Approximately 0.51 (Light Blue)
* College: Approximately 0.40 (Dark Blue)
* **O1-Preview:**
* High School: Approximately 0.63 (Light Blue)
* College: Approximately 0.53 (Dark Blue)
* **Qwen2-72B:**
* High School: Approximately 0.39 (Light Blue)
* College: Approximately 0.28 (Dark Blue)
* **GLM-4:**
* High School: Approximately 0.37 (Light Blue)
* College: Approximately 0.22 (Dark Blue)
The light blue bars (high school) generally appear taller than the dark blue bars (college) for each model, indicating higher MR-Scores on the high school difficulty level.
### Key Observations
* O1-Preview consistently achieves the highest MR-Scores across both difficulty levels.
* GLM-4 consistently achieves the lowest MR-Scores across both difficulty levels.
* The difference between high school and college MR-Scores is most pronounced for O1-Preview and Qwen2-72B.
* GPT-4-turbo shows a relatively large drop in MR-Score when moving from high school to college difficulty.
### Interpretation
The data suggests that the O1-Preview model performs best on the tested tasks, regardless of difficulty. Conversely, GLM-4 performs the worst. The consistent trend of higher scores on the high school difficulty level across all models indicates that the tasks associated with this level are generally easier for these models to handle. The varying degree of performance drop between difficulty levels suggests that some models are more robust to increased task complexity than others. The MR-Score metric is likely measuring some aspect of reasoning or problem-solving ability, and the chart provides a comparative assessment of these models' capabilities. The difference in performance between the models could be due to differences in model architecture, training data, or other factors. Further investigation would be needed to understand the specific reasons for these performance differences.