## Bar Chart: MR-Scores of Models on Different Difficulty Levels
### Overview
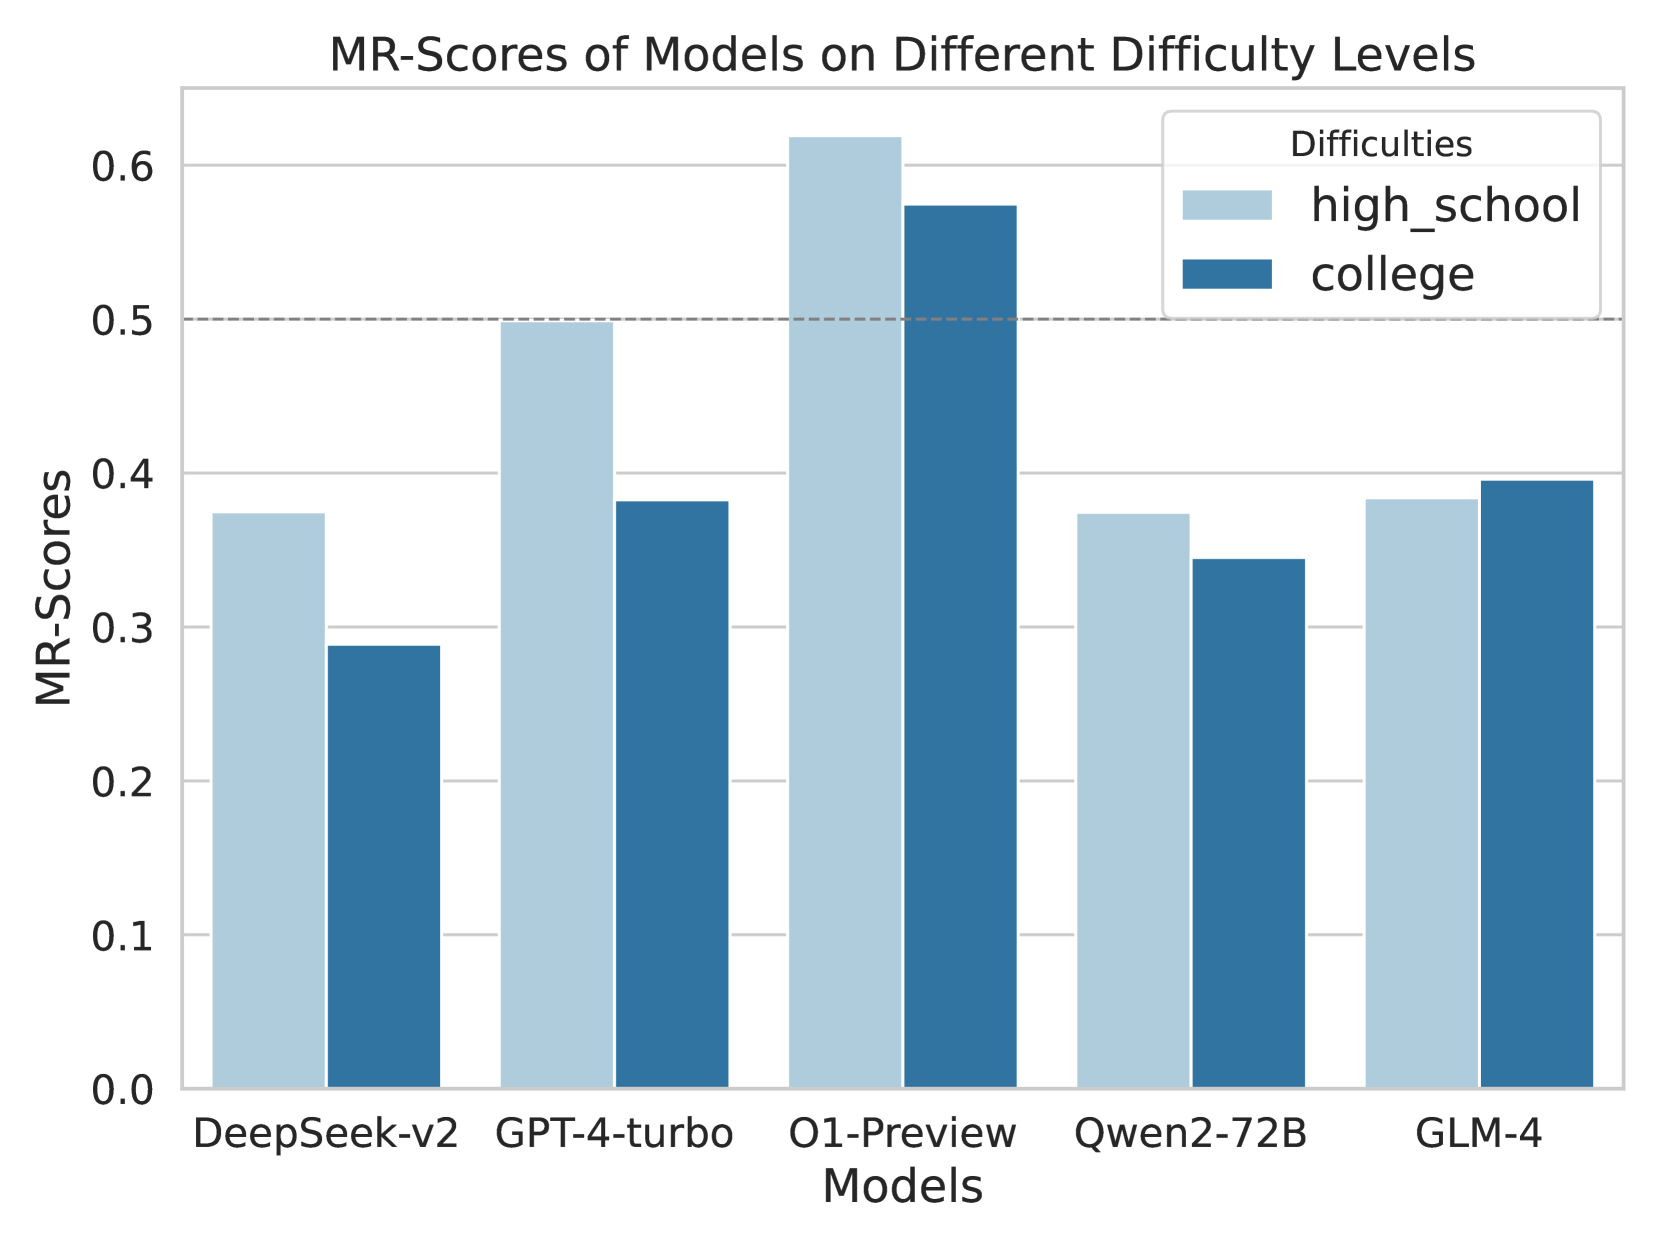
The image is a grouped bar chart comparing the "MR-Scores" of five different AI models across two difficulty levels: "high_school" and "college". The chart visually presents performance data, with each model having two adjacent bars representing the two difficulty categories.
### Components/Axes
* **Chart Title:** "MR-Scores of Models on Different Difficulty Levels"
* **Y-Axis:**
* **Label:** "MR-Scores"
* **Scale:** Linear, ranging from 0.0 to 0.6, with major gridlines at intervals of 0.1.
* **Notable Feature:** A horizontal dashed line is present at the 0.5 mark.
* **X-Axis:**
* **Label:** "Models"
* **Categories (from left to right):** DeepSeek-v2, GPT-4-turbo, O1-Preview, Qwen2-72B, GLM-4.
* **Legend:**
* **Title:** "Difficulties"
* **Position:** Top-right corner of the chart area.
* **Items:**
* Light blue square: "high_school"
* Dark blue square: "college"
### Detailed Analysis
The chart displays the following approximate MR-Scores for each model and difficulty level. Values are estimated based on bar height relative to the y-axis gridlines.
| Model | Difficulty Level (Bar Color) | Approximate MR-Score | Visual Trend vs. Other Difficulty |
| :--- | :--- | :--- | :--- |
| **DeepSeek-v2** | high_school (Light Blue) | ~0.38 | Higher than college score |
| | college (Dark Blue) | ~0.29 | Lower than high_school score |
| **GPT-4-turbo** | high_school (Light Blue) | ~0.50 | Significantly higher than college score |
| | college (Dark Blue) | ~0.38 | Lower than high_school score |
| **O1-Preview** | high_school (Light Blue) | ~0.62 | Highest score on the chart; higher than college score |
| | college (Dark Blue) | ~0.58 | Second highest score on the chart; lower than high_school score |
| **Qwen2-72B** | high_school (Light Blue) | ~0.38 | Slightly higher than college score |
| | college (Dark Blue) | ~0.35 | Slightly lower than high_school score |
| **GLM-4** | high_school (Light Blue) | ~0.39 | Slightly lower than college score |
| | college (Dark Blue) | ~0.40 | Slightly higher than high_school score |
### Key Observations
1. **Top Performer:** The O1-Preview model achieves the highest MR-Scores in both difficulty categories, with its "high_school" score being the only one to exceed the 0.6 mark.
2. **Performance Gap:** For four out of the five models (DeepSeek-v2, GPT-4-turbo, O1-Preview, Qwen2-72B), the MR-Score on the "high_school" difficulty is higher than on the "college" difficulty. The gap is most pronounced for GPT-4-turbo.
3. **Exception to the Trend:** The GLM-4 model is the only one where the "college" difficulty score (~0.40) is marginally higher than the "high_school" score (~0.39).
4. **Clustering:** The scores for DeepSeek-v2, Qwen2-72B, and GLM-4 are relatively clustered in the 0.29 to 0.40 range, while GPT-4-turbo and O1-Preview occupy a higher performance tier.
5. **Threshold Line:** The dashed line at 0.5 serves as a visual benchmark. Only the O1-Preview model surpasses this threshold for both difficulty levels, while GPT-4-turbo meets it exactly for the "high_school" level.
### Interpretation
The data suggests a comparative evaluation of AI model reasoning capabilities (as measured by "MR-Scores") on problems categorized by academic difficulty. The consistent pattern of higher scores on "high_school" problems for most models indicates that these models generally find this level of difficulty more manageable than "college" level problems. This is an expected outcome, as college-level material is typically more complex.
The standout performance of O1-Preview implies it has superior reasoning abilities relative to the other models tested, across both difficulty tiers. The anomalous result for GLM-4, where it performs slightly better on college-level problems, could indicate several possibilities: a specific strength in the domain of college-level questions used in the test, a potential quirk in the evaluation dataset, or simply statistical noise given the small margin. The chart effectively highlights both the general hierarchy of model performance and the nuanced relationship between problem difficulty and model capability.