# Technical Document Analysis: Scatter Plot of Dataset Clusters
## Key Components Extracted:
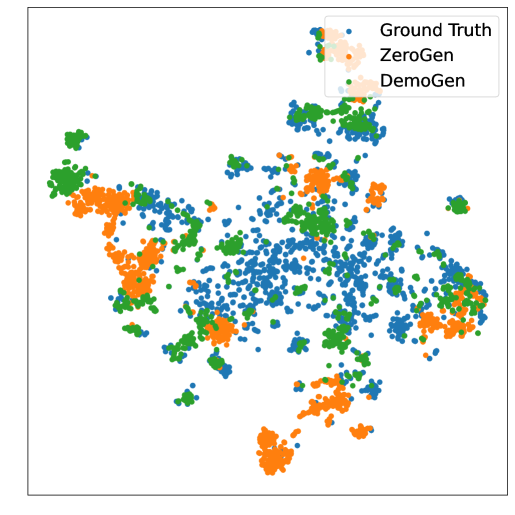
### Legend:
- **Labels & Colors**:
- `Ground Truth`: Light pink
- `ZeroGen`: Blue
- `DemoGen`: Orange
### Axes:
- **X-axis**: Labeled "Feature 1" (no numerical markers)
- **Y-axis**: Labeled "Feature 2" (no numerical markers)
### Plot Structure:
- **Type**: Scatter plot
- **Data Points**:
- **Ground Truth** (light pink): Clustered in the top-right quadrant, forming dense groupings.
- **ZeroGen** (blue): Predominantly concentrated in the bottom-left quadrant, with some overlap in the central region.
- **DemoGen** (orange): Distributed across the plot, with significant overlap between Ground Truth and ZeroGen clusters, particularly in the central and lower-right regions.
### Observations:
1. **Cluster Separation**:
- Ground Truth and ZeroGen exhibit distinct spatial separation in their primary clusters.
- DemoGen demonstrates mixed distribution, suggesting potential overlap or transitional behavior between the two primary datasets.
2. **Overlap Patterns**:
- DemoGen points frequently intermingle with both Ground Truth and ZeroGen clusters, indicating possible ambiguity in classification or generation quality.
3. **Density**:
- Ground Truth clusters show higher density in the top-right region.
- ZeroGen clusters exhibit moderate density in the bottom-left region.
## Technical Notes:
- No numerical axis markers or scale values are present, limiting quantitative analysis.
- The plot emphasizes qualitative clustering behavior rather than precise metric evaluation.
- Legend labels are unambiguously mapped to their respective colors in the visualization.