## Chart Type: Performance Comparison Line Graphs
### Overview
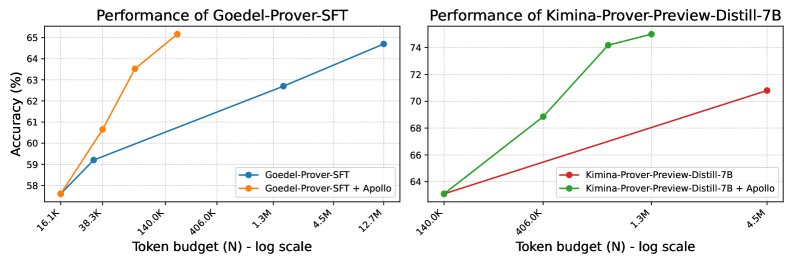
The image presents two line graphs comparing the performance (accuracy in percentage) of different models against the token budget (N) on a logarithmic scale. The left graph compares "Goedel-Prover-SFT" with and without "Apollo," while the right graph compares "Kimina-Prover-Preview-Distill-7B" with and without "Apollo."
### Components/Axes
* **Left Graph Title:** Performance of Goedel-Prover-SFT
* **Right Graph Title:** Performance of Kimina-Prover-Preview-Distill-7B
* **Y-axis (both graphs):** Accuracy (%) - Linear Scale
* Left Graph: Ranges from 58% to 65% with gridlines at each integer percentage.
* Right Graph: Ranges from 64% to 74% with gridlines at each integer percentage.
* **X-axis (both graphs):** Token budget (N) - log scale
* Left Graph: 16.1K, 38.3K, 140.0K, 406.0K, 1.3M, 4.5M, 12.7M
* Right Graph: 140.0K, 406.0K, 1.3M, 4.5M
* **Legends:**
* **Left Graph:** Located in the bottom-right corner.
* Blue: Goedel-Prover-SFT
* Orange: Goedel-Prover-SFT + Apollo
* **Right Graph:** Located in the bottom-center.
* Red: Kimina-Prover-Preview-Distill-7B
* Green: Kimina-Prover-Preview-Distill-7B + Apollo
### Detailed Analysis
**Left Graph: Goedel-Prover-SFT**
* **Goedel-Prover-SFT (Blue):** The line slopes upward, indicating increasing accuracy with a larger token budget.
* 16.1K: Approximately 57.7%
* 38.3K: Approximately 59.2%
* 140.0K: Approximately 60.1%
* 406.0K: Approximately 60.9%
* 1.3M: Approximately 62.2%
* 4.5M: Approximately 62.8%
* 12.7M: Approximately 64.7%
* **Goedel-Prover-SFT + Apollo (Orange):** The line slopes upward, indicating increasing accuracy with a larger token budget. The increase is more pronounced at lower token budgets.
* 16.1K: Approximately 57.6%
* 38.3K: Approximately 60.6%
* 140.0K: Approximately 63.5%
* 406.0K: Approximately 65.1%
**Right Graph: Kimina-Prover-Preview-Distill-7B**
* **Kimina-Prover-Preview-Distill-7B (Red):** The line slopes upward, indicating increasing accuracy with a larger token budget.
* 140.0K: Approximately 63.2%
* 406.0K: Approximately 65.2%
* 1.3M: Approximately 66.2%
* 4.5M: Approximately 70.8%
* **Kimina-Prover-Preview-Distill-7B + Apollo (Green):** The line slopes upward, indicating increasing accuracy with a larger token budget. The increase is more pronounced at lower token budgets, with a plateau after 1.3M tokens.
* 140.0K: Approximately 63.1%
* 406.0K: Approximately 68.8%
* 1.3M: Approximately 74.1%
* 4.5M: Approximately 74.6%
### Key Observations
* In the left graph, the "Goedel-Prover-SFT + Apollo" model consistently outperforms the base "Goedel-Prover-SFT" model, especially at lower token budgets.
* In the right graph, the "Kimina-Prover-Preview-Distill-7B + Apollo" model significantly outperforms the base "Kimina-Prover-Preview-Distill-7B" model.
* The "Apollo" addition seems to provide a more significant boost to the "Kimina" model than to the "Goedel" model.
* For the "Kimina-Prover-Preview-Distill-7B + Apollo" model, the performance plateaus after 1.3M tokens, suggesting diminishing returns for larger token budgets.
### Interpretation
The graphs demonstrate the impact of adding "Apollo" to two different models ("Goedel-Prover-SFT" and "Kimina-Prover-Preview-Distill-7B") in terms of accuracy as a function of the token budget. The addition of "Apollo" consistently improves the performance of both models, but the effect is more pronounced for the "Kimina" model. The plateau in performance for "Kimina-Prover-Preview-Distill-7B + Apollo" suggests that there may be a point of diminishing returns in increasing the token budget for this particular model configuration. The data suggests that "Apollo" is a beneficial addition to both models, but its impact varies depending on the base model architecture.