\n
## Dual Line Charts: Performance Comparison of Two AI Models with and without "Apollo" Enhancement
### Overview
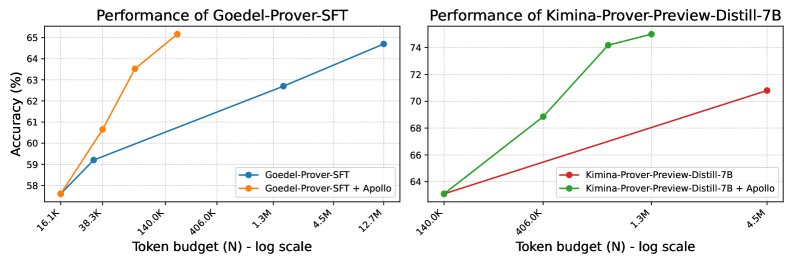
The image displays two side-by-side line charts comparing the performance (accuracy) of two different AI models against an increasing token budget. The left chart analyzes "Goedel-Prover-SFT," and the right chart analyzes "Kimina-Prover-Preview-Distill-7B." Each chart plots two series: the base model and the model enhanced with a method called "Apollo." The x-axis uses a logarithmic scale for the token budget (N).
### Components/Axes
**Common Elements:**
* **Chart Type:** Two separate line charts arranged horizontally.
* **X-Axis (Both Charts):** Label: `Token budget (N) - log scale`. The scale is logarithmic, with major tick marks at specific token counts.
* **Y-Axis (Both Charts):** Label: `Accuracy (%)`. The scale is linear.
* **Legends:** Located in the bottom-right corner of each chart's plot area.
**Left Chart: "Performance of Goedel-Prover-SFT"**
* **Title:** `Performance of Goedel-Prover-SFT` (centered at top).
* **Y-Axis Range:** Approximately 58% to 65%.
* **X-Axis Ticks (Approximate Values):** `16.1K`, `38.3K`, `140.0K`, `400.0K`, `1.3M`, `4.5M`, `12.7M`.
* **Legend:**
* Blue line with circle markers: `Goedel-Prover-SFT`
* Orange line with circle markers: `Goedel-Prover-SFT + Apollo`
**Right Chart: "Performance of Kimina-Prover-Preview-Distill-7B"**
* **Title:** `Performance of Kimina-Prover-Preview-Distill-7B` (centered at top).
* **Y-Axis Range:** Approximately 64% to 74%.
* **X-Axis Ticks (Approximate Values):** `140.0K`, `400.0K`, `1.3M`, `4.5M`.
* **Legend:**
* Red line with circle markers: `Kimina-Prover-Preview-Distill-7B`
* Green line with circle markers: `Kimina-Prover-Preview-Distill-7B + Apollo`
### Detailed Analysis
**Left Chart: Goedel-Prover-SFT**
* **Trend Verification:** Both lines show a positive correlation between token budget and accuracy. The orange line (`+ Apollo`) has a steeper upward slope than the blue line, indicating a greater performance gain per token budget increase.
* **Data Points (Approximate):**
* **Goedel-Prover-SFT (Blue):** Starts at (16.1K, ~57.5%), rises to (38.3K, ~59.3%), then to (1.3M, ~62.5%), and ends at (12.7M, ~64.5%).
* **Goedel-Prover-SFT + Apollo (Orange):** Starts at the same point as the blue line (16.1K, ~57.5%), rises sharply to (38.3K, ~60.7%), then to (140.0K, ~63.5%), and ends at (400.0K, ~65.5%). The orange line terminates at a lower token budget (400.0K) than the blue line's final point.
**Right Chart: Kimina-Prover-Preview-Distill-7B**
* **Trend Verification:** Both lines show a positive correlation. The green line (`+ Apollo`) has a significantly steeper slope than the red line, demonstrating a much more rapid improvement in accuracy.
* **Data Points (Approximate):**
* **Kimina-Prover-Preview-Distill-7B (Red):** Starts at (140.0K, ~63.5%), rises to (4.5M, ~71.0%).
* **Kimina-Prover-Preview-Distill-7B + Apollo (Green):** Starts at the same point as the red line (140.0K, ~63.5%), rises sharply to (400.0K, ~69.0%), then to (1.3M, ~74.5%), and ends at (4.5M, ~75.0%). The green line shows a near-plateau between 1.3M and 4.5M tokens.
### Key Observations
1. **Apollo Enhancement is Effective:** In both models, the version with "+ Apollo" achieves higher accuracy than the base model at equivalent or lower token budgets.
2. **Diminishing Returns:** The green line (Kimina + Apollo) shows clear diminishing returns, with the accuracy gain between 1.3M and 4.5M tokens being minimal (~0.5%) compared to the large jump from 400.0K to 1.3M (~5.5%).
3. **Model Comparison:** The Kimina model (right chart) operates in a higher accuracy regime (64-75%) compared to the Goedel model (58-65.5%) within the shown token budgets.
4. **Efficiency:** The Apollo-enhanced models reach higher accuracy levels with fewer tokens. For example, Goedel-Prover-SFT + Apollo at 400.0K tokens (~65.5%) outperforms the base Goedel model at 12.7M tokens (~64.5%).
### Interpretation
The data suggests that the "Apollo" method is a successful technique for improving the sample efficiency of these language models, likely in a reasoning or proof-generation task given the model names ("Prover"). It allows the models to achieve better performance with a smaller computational budget (fewer tokens processed).
The steeper curves for the Apollo-enhanced versions indicate a better "return on investment" for additional training or inference tokens. The plateau in the Kimina + Apollo line is a critical finding, suggesting that for this specific model and task, scaling the token budget beyond ~1.3 million yields minimal benefit, which has important implications for resource allocation and cost optimization.
The charts effectively argue for the value of the Apollo enhancement, showing it not only boosts peak performance but also improves the efficiency of scaling. The use of a log scale on the x-axis is appropriate, as it clearly visualizes performance across orders of magnitude of token budgets, highlighting the efficiency gains.