## Bar Chart: Algorithm Performance Comparison
### Overview
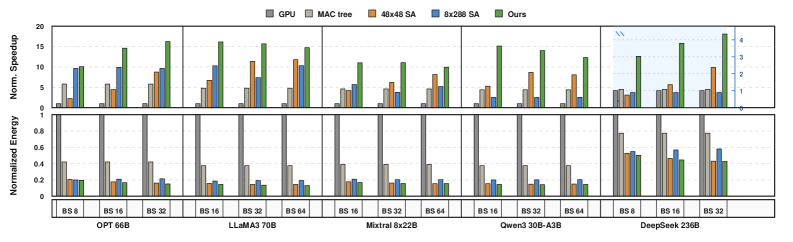
The image is a grouped bar chart comparing the performance of multiple algorithms across two metrics: **Normalized Energy** and **Normalized Speedup**. The chart evaluates seven algorithms (OPT 66B, LLaMA3 70B, Mixtra 8x22B, Owen3 30B-A3B, DeepSeek 236B) against five baseline methods (GPU, MAC tree, 48x48 SA, 8x288 SA, and "Ours"). Each algorithm is represented by a cluster of five bars, with colors corresponding to the legend.
### Components/Axes
- **X-axis**: Algorithms (OPT 66B, LLaMA3 70B, Mixtra 8x22B, Owen3 30B-A3B, DeepSeek 236B).
- **Y-axis (Top)**: Normalized Speedup (scale: 0–20).
- **Y-axis (Bottom)**: Normalized Energy (scale: 0–1).
- **Legend**:
- Gray: GPU
- Light Gray: MAC tree
- Orange: 48x48 SA
- Blue: 8x288 SA
- Green: Ours
### Detailed Analysis
#### Normalized Speedup (Top Y-axis)
- **OPT 66B**:
- GPU: ~10
- MAC tree: ~6
- 48x48 SA: ~5
- 8x288 SA: ~10
- Ours: ~15
- **LLaMA3 70B**:
- GPU: ~10
- MAC tree: ~5
- 48x48 SA: ~12
- 8x288 SA: ~8
- Ours: ~16
- **Mixtra 8x22B**:
- GPU: ~5
- MAC tree: ~4
- 48x48 SA: ~7
- 8x288 SA: ~6
- Ours: ~11
- **Owen3 30B-A3B**:
- GPU: ~5
- MAC tree: ~4
- 48x48 SA: ~9
- 8x288 SA: ~3
- Ours: ~14
- **DeepSeek 236B**:
- GPU: ~4
- MAC tree: ~3
- 48x48 SA: ~6
- 8x288 SA: ~4
- Ours: ~17
#### Normalized Energy (Bottom Y-axis)
- **OPT 66B**:
- GPU: ~0.4
- MAC tree: ~0.2
- 48x48 SA: ~0.2
- 8x288 SA: ~0.2
- Ours: ~0.15
- **LLaMA3 70B**:
- GPU: ~0.35
- MAC tree: ~0.25
- 48x48 SA: ~0.15
- 8x288 SA: ~0.1
- Ours: ~0.1
- **Mixtra 8x22B**:
- GPU: ~0.3
- MAC tree: ~0.2
- 48x48 SA: ~0.15
- 8x288 SA: ~0.1
- Ours: ~0.1
- **Owen3 30B-A3B**:
- GPU: ~0.3
- MAC tree: ~0.25
- 48x48 SA: ~0.15
- 8x288 SA: ~0.1
- Ours: ~0.1
- **DeepSeek 236B**:
- GPU: ~0.5
- MAC tree: ~0.4
- 48x48 SA: ~0.3
- 8x288 SA: ~0.3
- Ours: ~0.25
### Key Observations
1. **"Ours" consistently outperforms all baselines in normalized speedup** across all algorithms, with values ranging from 11 to 17 (vs. GPU’s 4–10).
2. **GPU has the highest speedup** but also the highest energy consumption (0.4–0.5), while "Ours" achieves lower energy (0.1–0.25).
3. **MAC tree underperforms in speedup** (3–6) but has moderate energy use (0.2–0.4).
4. **48x48 SA and 8x288 SA show mixed results**:
- 48x48 SA has higher speedup (5–12) but similar energy to "Ours".
- 8x288 SA has lower speedup (3–8) and higher energy than "Ours".
### Interpretation
The data suggests that **"Ours" algorithm achieves superior speedup with competitive energy efficiency** compared to all baselines. GPU, while fast, consumes significantly more energy, making it less optimal for energy-constrained scenarios. MAC tree’s low speedup indicates potential inefficiencies in its design. The 48x48 SA and 8x288 SA trade-offs between speed and energy highlight the importance of algorithm-specific optimizations. The chart underscores the need for balancing computational speed and energy consumption in algorithm selection.