## Bar Chart: Latency vs. Batch Size for FP16 and INT8
### Overview
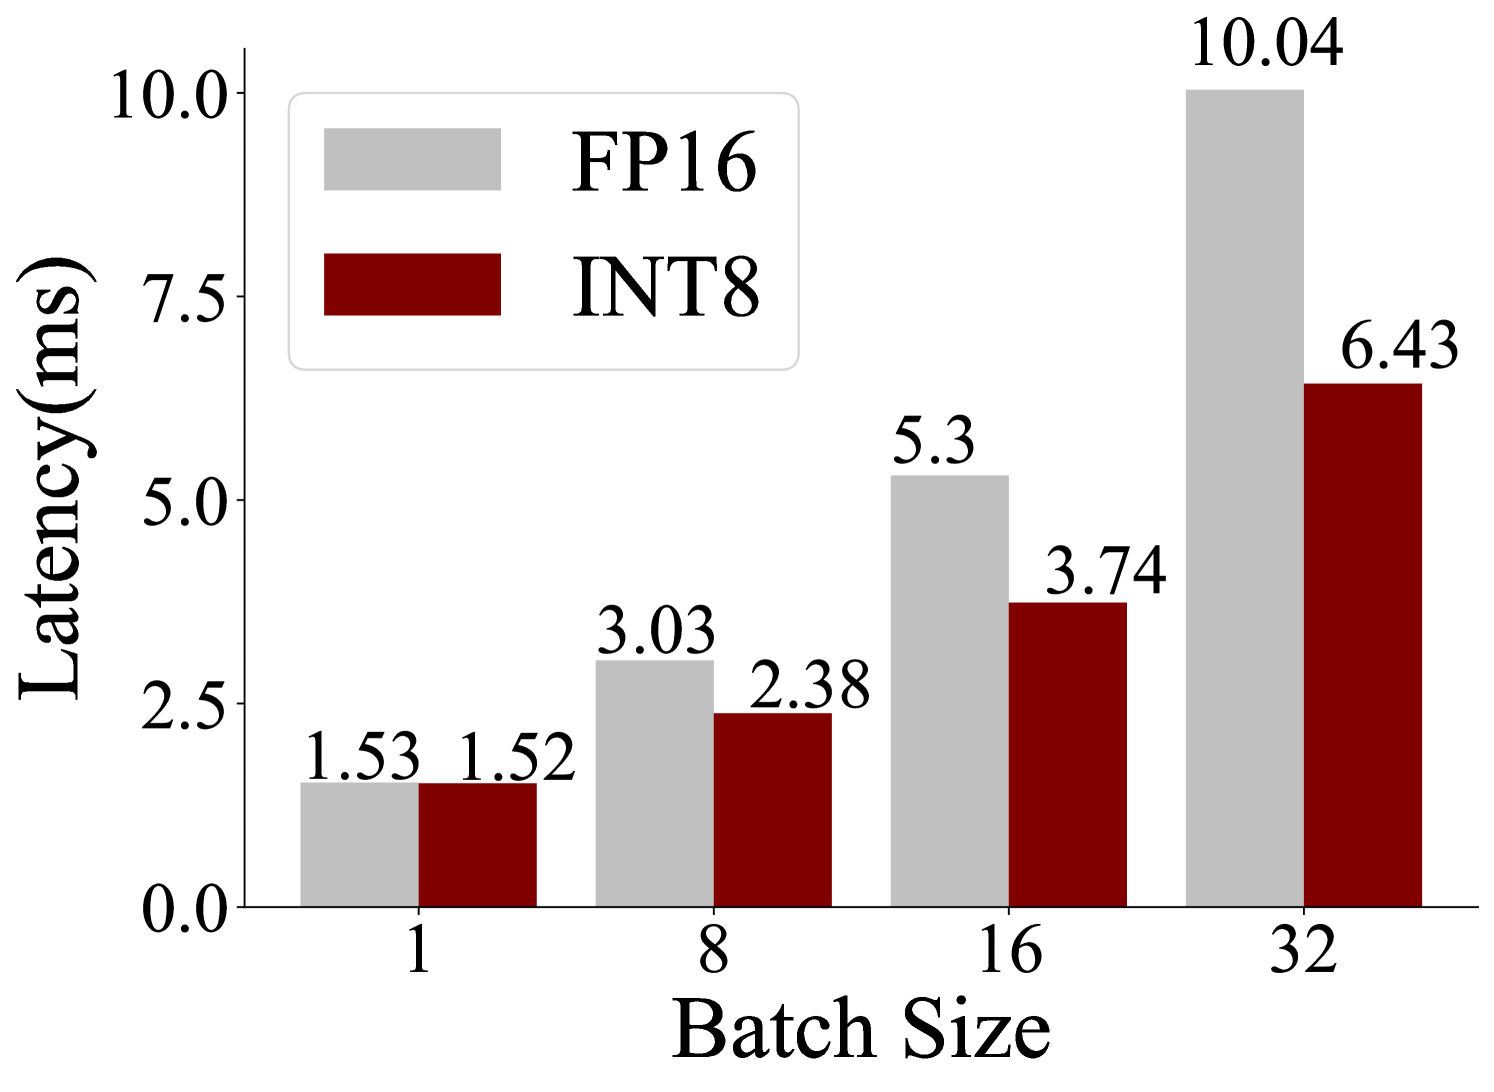
The image is a bar chart comparing the latency (in milliseconds) of FP16 and INT8 data types across different batch sizes (1, 8, 16, and 32). The chart shows that latency generally increases with batch size for both data types, but FP16 consistently exhibits higher latency than INT8 for each batch size.
### Components/Axes
* **Title:** There is no explicit title on the chart.
* **X-axis:** "Batch Size" with values 1, 8, 16, and 32.
* **Y-axis:** "Latency(ms)" with values 0.0, 2.5, 5.0, 7.5, and 10.0.
* **Legend:** Located in the top-center of the chart.
* Gray bar: FP16
* Dark Red bar: INT8
### Detailed Analysis
The chart presents latency measurements for FP16 (gray bars) and INT8 (dark red bars) at different batch sizes.
* **Batch Size 1:**
* FP16: 1.53 ms
* INT8: 1.52 ms
* **Batch Size 8:**
* FP16: 3.03 ms
* INT8: 2.38 ms
* **Batch Size 16:**
* FP16: 5.3 ms
* INT8: 3.74 ms
* **Batch Size 32:**
* FP16: 10.04 ms
* INT8: 6.43 ms
**Trends:**
* **FP16:** The latency for FP16 increases steadily as the batch size increases.
* **INT8:** The latency for INT8 also increases with batch size, but at a slower rate compared to FP16.
### Key Observations
* At batch size 1, the latency for FP16 and INT8 are nearly identical.
* The difference in latency between FP16 and INT8 becomes more pronounced as the batch size increases.
* The latency of FP16 almost doubles from batch size 16 to 32.
### Interpretation
The data suggests that INT8 is more efficient than FP16 in terms of latency, especially at larger batch sizes. This is likely due to the lower precision of INT8, which allows for faster computations. The increasing latency with batch size is expected, as larger batches require more processing time. The significant difference in latency between FP16 and INT8 at higher batch sizes indicates that using INT8 could provide substantial performance improvements in applications where latency is a critical factor.