\n
## Bar Chart: Latency vs. Batch Size for FP16 and INT8
### Overview
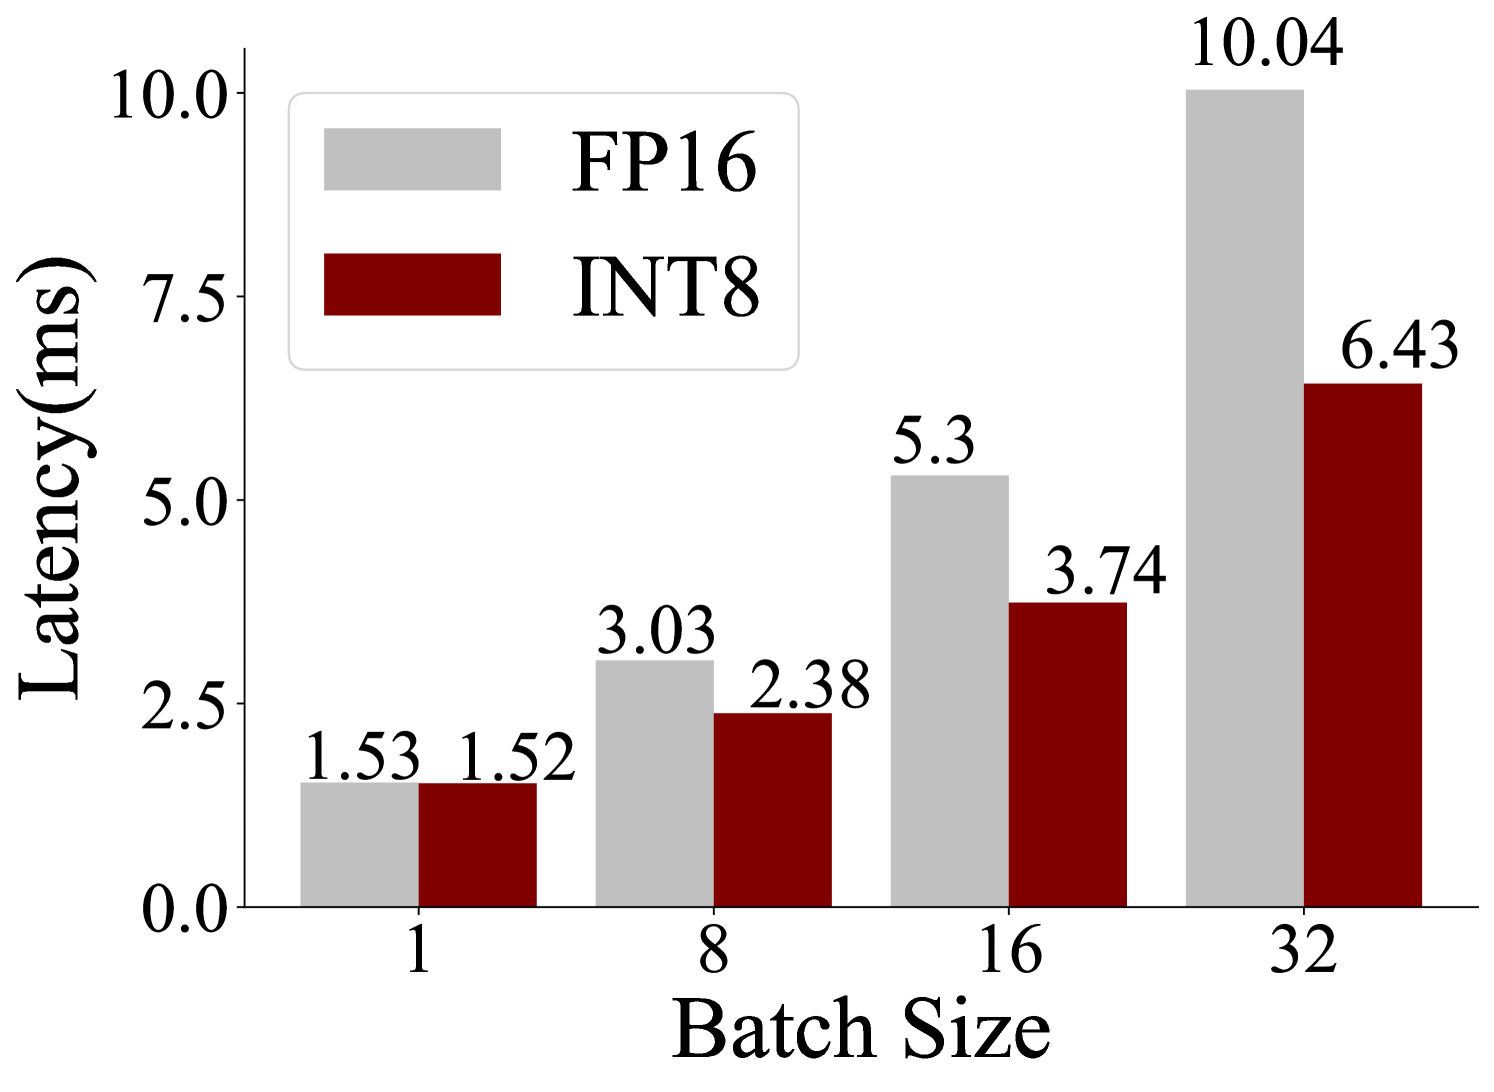
This bar chart compares the latency (in milliseconds) of two data types, FP16 and INT8, across different batch sizes (1, 8, 16, and 32). The chart uses a bar graph format to visually represent the latency for each combination of data type and batch size.
### Components/Axes
* **X-axis:** Batch Size (labeled as "Batch Size"). Markers are at 1, 8, 16, and 32.
* **Y-axis:** Latency (in milliseconds) (labeled as "Latency(ms)"). Scale ranges from 0.0 to 10.0, with increments of 2.5.
* **Legend:** Located in the top-left corner.
* FP16: Represented by a light gray color.
* INT8: Represented by a dark red color.
### Detailed Analysis
The chart presents latency values for each batch size and data type.
**FP16 Data Series:**
* Batch Size 1: Latency is approximately 1.53 ms.
* Batch Size 8: Latency is approximately 3.03 ms.
* Batch Size 16: Latency is approximately 5.3 ms.
* Batch Size 32: Latency is approximately 10.04 ms.
* Trend: The FP16 latency increases consistently as the batch size increases. The increase appears roughly linear.
**INT8 Data Series:**
* Batch Size 1: Latency is approximately 1.52 ms.
* Batch Size 8: Latency is approximately 2.38 ms.
* Batch Size 16: Latency is approximately 3.74 ms.
* Batch Size 32: Latency is approximately 6.43 ms.
* Trend: The INT8 latency also increases consistently as the batch size increases, similar to FP16. The increase appears roughly linear.
### Key Observations
* For all batch sizes, the latency of FP16 is slightly higher than that of INT8.
* The difference in latency between FP16 and INT8 appears to remain relatively constant across different batch sizes.
* Latency increases significantly as the batch size increases for both data types.
### Interpretation
The data suggests that using INT8 instead of FP16 can result in a small reduction in latency. However, the primary factor influencing latency is the batch size. Increasing the batch size leads to a substantial increase in latency for both data types. This is likely due to increased computational load and memory access requirements with larger batches. The consistent difference between FP16 and INT8 suggests that the benefits of using INT8 are independent of the batch size. This chart is useful for understanding the trade-offs between data type precision and performance (latency) in a system, and for determining the optimal batch size for a given application. The linear trend suggests that this relationship will continue for batch sizes beyond 32.