TECHNICAL ASSET FINGERPRINT
ddd33fb5621146d0be65f122
Click to view fullscreen
Press ESC or click to close
FOUND IN PAPERS
EXPERT: gemini-2.0-flash VERSION 1
RUNTIME: nugit/gemini/gemini-2.0-flash
INTEL_VERIFIED
## Chart: Llama-3.3-70B-Instruct Performance Comparison
### Overview
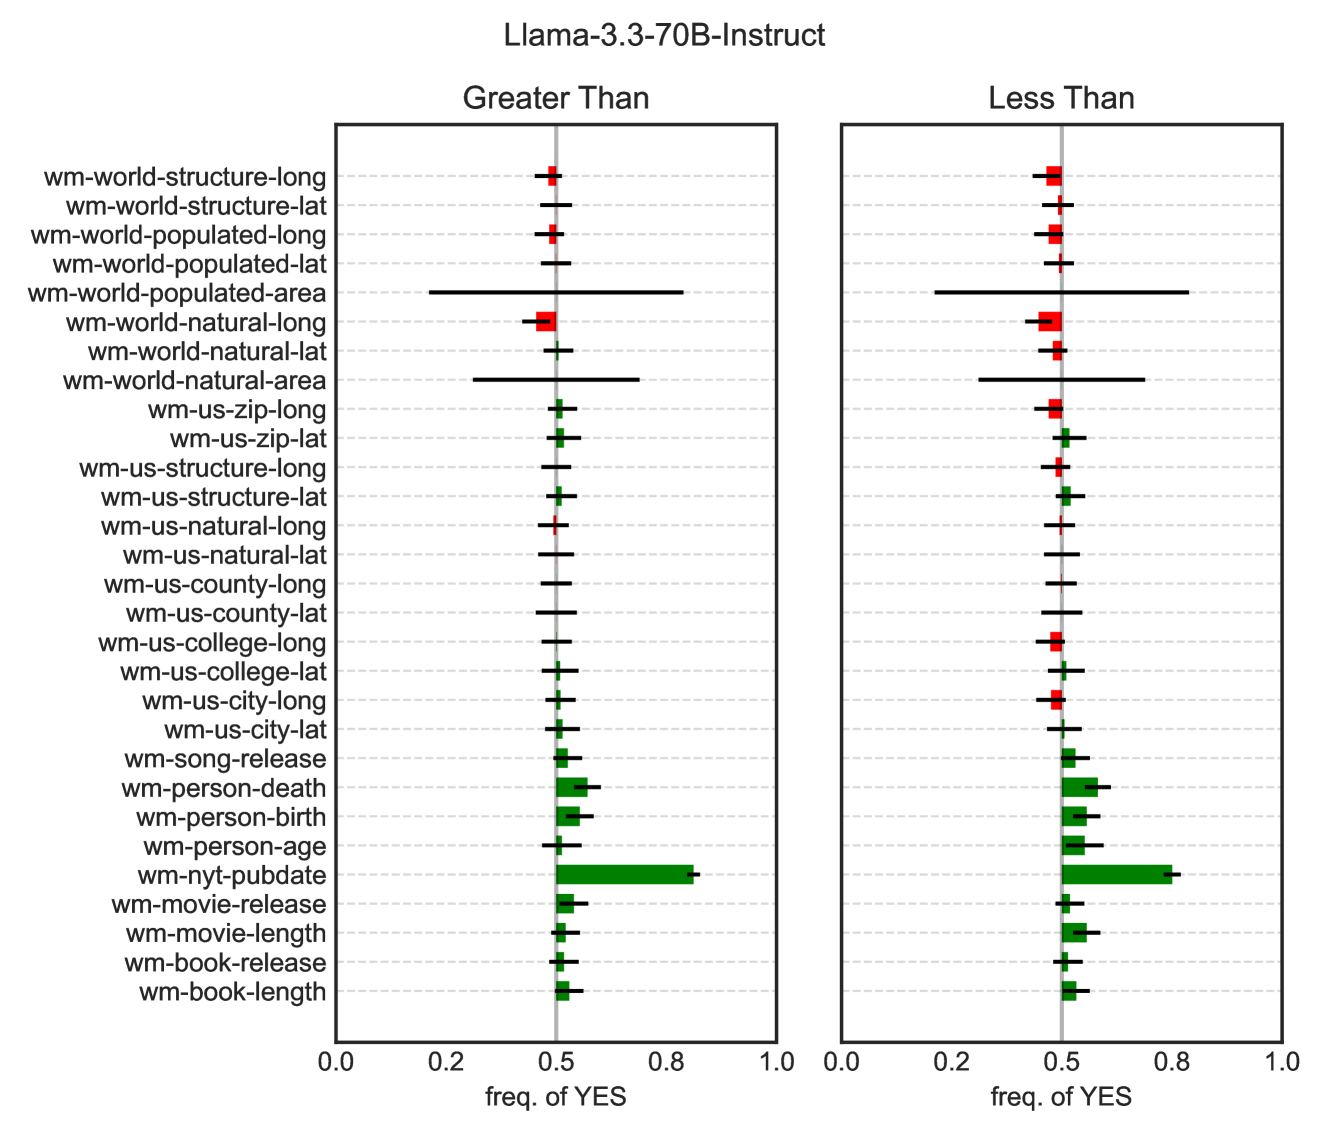
The image presents a comparative analysis of the Llama-3.3-70B-Instruct model's performance on a series of tasks, categorized by whether the prompt was "Greater Than" or "Less Than". The chart displays the frequency of "YES" responses for each task, with error bars indicating the uncertainty in the measurements. The tasks are listed along the y-axis, and the frequency of "YES" responses is plotted on the x-axis, ranging from 0.0 to 1.0.
### Components/Axes
* **Title:** Llama-3.3-70B-Instruct
* **X-axis Title:** freq. of YES
* **X-axis Scale:** 0.0, 0.2, 0.5, 0.8, 1.0
* **Y-axis Labels:**
* wm-world-structure-long
* wm-world-structure-lat
* wm-world-populated-long
* wm-world-populated-lat
* wm-world-populated-area
* wm-world-natural-long
* wm-world-natural-lat
* wm-world-natural-area
* wm-us-zip-long
* wm-us-zip-lat
* wm-us-structure-long
* wm-us-structure-lat
* wm-us-natural-long
* wm-us-natural-lat
* wm-us-county-long
* wm-us-county-lat
* wm-us-college-long
* wm-us-college-lat
* wm-us-city-long
* wm-us-city-lat
* wm-song-release
* wm-person-death
* wm-person-birth
* wm-person-age
* wm-nyt-pubdate
* wm-movie-release
* wm-movie-length
* wm-book-release
* wm-book-length
* **Chart Type:** Paired bar charts with error bars.
* **Categories:** "Greater Than" (left chart) and "Less Than" (right chart).
* **Data Representation:** Each task is represented by a horizontal bar, with the length of the bar indicating the frequency of "YES" responses. Error bars are displayed as black lines extending from each bar.
* **Color Coding:** The bars are colored either green or red. It is not explicitly stated what the colors represent, but it can be inferred that green represents a higher frequency of "YES" responses and red represents a lower frequency.
### Detailed Analysis
**Greater Than:**
* **wm-world-structure-long:** Frequency of YES is approximately 0.5 with a small error bar. Color is red.
* **wm-world-structure-lat:** Frequency of YES is approximately 0.5 with a small error bar. Color is red.
* **wm-world-populated-long:** Frequency of YES is approximately 0.5 with a small error bar. Color is red.
* **wm-world-populated-lat:** Frequency of YES is approximately 0.5 with a larger error bar, extending from approximately 0.3 to 0.7. Color is red.
* **wm-world-populated-area:** Frequency of YES is approximately 0.5 with a larger error bar, extending from approximately 0.3 to 0.7. Color is red.
* **wm-world-natural-long:** Frequency of YES is approximately 0.5 with a small error bar. Color is red.
* **wm-world-natural-lat:** Frequency of YES is approximately 0.5 with a larger error bar, extending from approximately 0.3 to 0.7. Color is red.
* **wm-world-natural-area:** Frequency of YES is approximately 0.5 with a small error bar. Color is green.
* **wm-us-zip-long:** Frequency of YES is approximately 0.5 with a small error bar. Color is green.
* **wm-us-zip-lat:** Frequency of YES is approximately 0.5 with a small error bar. Color is green.
* **wm-us-structure-long:** Frequency of YES is approximately 0.5 with a small error bar. Color is green.
* **wm-us-structure-lat:** Frequency of YES is approximately 0.5 with a small error bar. Color is red.
* **wm-us-natural-long:** Frequency of YES is approximately 0.5 with a small error bar. Color is red.
* **wm-us-natural-lat:** Frequency of YES is approximately 0.5 with a small error bar. Color is red.
* **wm-us-county-long:** Frequency of YES is approximately 0.5 with a small error bar. Color is red.
* **wm-us-county-lat:** Frequency of YES is approximately 0.5 with a small error bar. Color is red.
* **wm-us-college-long:** Frequency of YES is approximately 0.5 with a small error bar. Color is red.
* **wm-us-college-lat:** Frequency of YES is approximately 0.5 with a small error bar. Color is green.
* **wm-us-city-long:** Frequency of YES is approximately 0.5 with a small error bar. Color is green.
* **wm-us-city-lat:** Frequency of YES is approximately 0.5 with a small error bar. Color is green.
* **wm-song-release:** Frequency of YES is approximately 0.5 with a small error bar. Color is green.
* **wm-person-death:** Frequency of YES is approximately 0.6 with a small error bar. Color is green.
* **wm-person-birth:** Frequency of YES is approximately 0.6 with a small error bar. Color is green.
* **wm-person-age:** Frequency of YES is approximately 0.6 with a small error bar. Color is green.
* **wm-nyt-pubdate:** Frequency of YES is approximately 0.8 with a small error bar. Color is green.
* **wm-movie-release:** Frequency of YES is approximately 0.5 with a small error bar. Color is green.
* **wm-movie-length:** Frequency of YES is approximately 0.5 with a small error bar. Color is green.
* **wm-book-release:** Frequency of YES is approximately 0.5 with a small error bar. Color is green.
* **wm-book-length:** Frequency of YES is approximately 0.5 with a small error bar. Color is green.
**Less Than:**
* **wm-world-structure-long:** Frequency of YES is approximately 0.5 with a small error bar. Color is red.
* **wm-world-structure-lat:** Frequency of YES is approximately 0.5 with a small error bar. Color is red.
* **wm-world-populated-long:** Frequency of YES is approximately 0.5 with a small error bar. Color is red.
* **wm-world-populated-lat:** Frequency of YES is approximately 0.5 with a larger error bar, extending from approximately 0.3 to 0.7. Color is red.
* **wm-world-populated-area:** Frequency of YES is approximately 0.5 with a larger error bar, extending from approximately 0.3 to 0.7. Color is red.
* **wm-world-natural-long:** Frequency of YES is approximately 0.5 with a small error bar. Color is red.
* **wm-world-natural-lat:** Frequency of YES is approximately 0.5 with a larger error bar, extending from approximately 0.3 to 0.7. Color is red.
* **wm-world-natural-area:** Frequency of YES is approximately 0.5 with a small error bar. Color is green.
* **wm-us-zip-long:** Frequency of YES is approximately 0.5 with a small error bar. Color is green.
* **wm-us-zip-lat:** Frequency of YES is approximately 0.5 with a small error bar. Color is green.
* **wm-us-structure-long:** Frequency of YES is approximately 0.5 with a small error bar. Color is green.
* **wm-us-structure-lat:** Frequency of YES is approximately 0.5 with a small error bar. Color is red.
* **wm-us-natural-long:** Frequency of YES is approximately 0.5 with a small error bar. Color is red.
* **wm-us-natural-lat:** Frequency of YES is approximately 0.5 with a small error bar. Color is red.
* **wm-us-county-long:** Frequency of YES is approximately 0.5 with a small error bar. Color is red.
* **wm-us-county-lat:** Frequency of YES is approximately 0.5 with a small error bar. Color is red.
* **wm-us-college-long:** Frequency of YES is approximately 0.5 with a small error bar. Color is red.
* **wm-us-college-lat:** Frequency of YES is approximately 0.5 with a small error bar. Color is green.
* **wm-us-city-long:** Frequency of YES is approximately 0.5 with a small error bar. Color is green.
* **wm-us-city-lat:** Frequency of YES is approximately 0.5 with a small error bar. Color is green.
* **wm-song-release:** Frequency of YES is approximately 0.5 with a small error bar. Color is green.
* **wm-person-death:** Frequency of YES is approximately 0.6 with a small error bar. Color is green.
* **wm-person-birth:** Frequency of YES is approximately 0.6 with a small error bar. Color is green.
* **wm-person-age:** Frequency of YES is approximately 0.8 with a small error bar. Color is green.
* **wm-nyt-pubdate:** Frequency of YES is approximately 0.8 with a small error bar. Color is green.
* **wm-movie-release:** Frequency of YES is approximately 0.5 with a small error bar. Color is green.
* **wm-movie-length:** Frequency of YES is approximately 0.5 with a small error bar. Color is green.
* **wm-book-release:** Frequency of YES is approximately 0.5 with a small error bar. Color is green.
* **wm-book-length:** Frequency of YES is approximately 0.5 with a small error bar. Color is green.
### Key Observations
* For most tasks, the frequency of "YES" responses hovers around 0.5.
* The "wm-nyt-pubdate" task shows a significantly higher frequency of "YES" responses (approximately 0.8) in both "Greater Than" and "Less Than" categories.
* Tasks related to "person" (death, birth, age) also show a relatively higher frequency of "YES" responses.
* The error bars for "wm-world-populated-lat", "wm-world-populated-area", and "wm-world-natural-lat" are notably larger than for other tasks, indicating greater variability in the model's responses for these tasks.
* The color coding (red vs. green) appears to be related to the relative performance of the model on each task, with green indicating a higher frequency of "YES" responses.
### Interpretation
The chart provides insights into the Llama-3.3-70B-Instruct model's ability to handle different types of prompts and tasks. The fact that most tasks have a frequency of "YES" responses around 0.5 suggests that the model is often uncertain or ambivalent in its responses. The higher frequency of "YES" responses for "wm-nyt-pubdate" and "person"-related tasks indicates that the model may be better at handling tasks related to dates and personal information. The larger error bars for certain tasks suggest that the model's performance on these tasks is less consistent.
The comparison between "Greater Than" and "Less Than" categories reveals that the model's performance is generally similar across these two categories, with no major differences in the frequency of "YES" responses for most tasks. This suggests that the model is not significantly biased towards either "Greater Than" or "Less Than" prompts.
DECODING INTELLIGENCE...
EXPERT: nemotron-free VERSION 1
RUNTIME: free/nvidia/nemotron-nano-12b-v2-vl:free
INTEL_VERIFIED
## Box Plot: Llama-3.3-70B-Instruct Response Frequency Distribution
### Overview
The image shows two side-by-side box plots comparing the frequency of "YES" responses for various Llama-3.3-70B-Instruct model outputs. The plots are divided into "Greater Than" (median) and "Less Than" (median) categories, with categories listed on the y-axis and frequency values (0-1.0) on the x-axis.
### Components/Axes
- **Title**: "Llama-3.3-70B-Instruct"
- **Subplots**:
- Left: "Greater Than" (median)
- Right: "Less Than" (median)
- **Y-Axis**: Categories (model outputs) listed vertically:
- `wm-world-structure-long`, `wm-world-structure-lat`, `wm-world-populated-long`, `wm-world-populated-lat`, `wm-world-populated-area`, `wm-world-natural-long`, `wm-world-natural-lat`, `wm-world-natural-area`, `wm-us-zip-long`, `wm-us-zip-lat`, `wm-us-structure-long`, `wm-us-structure-lat`, `wm-us-natural-long`, `wm-us-natural-lat`, `wm-us-county-long`, `wm-us-county-lat`, `wm-us-college-long`, `wm-us-college-lat`, `wm-us-city-long`, `wm-us-city-lat`, `wm-song-release`, `wm-person-death`, `wm-person-birth`, `wm-person-age`, `wm-nyt-pubdate`, `wm-movie-release`, `wm-movie-length`, `wm-book-release`, `wm-book-length`
- **X-Axis**: "freq. of YES" (0.0 to 1.0)
- **Legend**:
- Red: "Greater Than" (median)
- Green: "Less Than" (median)
- **Axis Markers**: Dotted grid lines at 0.0, 0.2, 0.4, 0.6, 0.8, 1.0
### Detailed Analysis
#### Left Plot ("Greater Than" Median)
- **Median Line**: Vertical line at ~0.5 for most categories.
- **Key Categories**:
- `wm-world-populated-area`: Red box spans ~0.5–0.7 (median ~0.6).
- `wm-nyt-pubdate`: Red box spans ~0.7–0.9 (median ~0.8).
- `wm-movie-release`: Red box spans ~0.6–0.8 (median ~0.7).
- **Outliers**:
- `wm-nyt-pubdate` and `wm-movie-release` show outliers above 0.9.
#### Right Plot ("Less Than" Median)
- **Median Line**: Vertical line at ~0.5 for most categories.
- **Key Categories**:
- `wm-world-populated-area`: Green box spans ~0.3–0.5 (median ~0.4).
- `wm-nyt-pubdate`: Green box spans ~0.1–0.3 (median ~0.2).
- `wm-person-age`: Green box spans ~0.4–0.6 (median ~0.5).
- **Outliers**:
- `wm-person-age` and `wm-nyt-pubdate` show outliers below 0.1.
### Key Observations
1. **Median Consistency**: Most categories cluster around the 0.5 median line, indicating balanced "YES" response frequencies.
2. **High Variability**:
- `wm-nyt-pubdate` and `wm-movie-release` show significant outliers in the "Greater Than" plot.
- `wm-person-age` and `wm-nyt-pubdate` show outliers in the "Less Than" plot.
3. **Category-Specific Trends**:
- `wm-world-populated-area` has the highest median in "Greater Than" (~0.6) and lowest in "Less Than" (~0.4).
- `wm-nyt-pubdate` exhibits the largest spread in both plots.
### Interpretation
The chart reveals how different model outputs vary in their likelihood of generating "YES" responses. Categories like `wm-world-populated-area` and `wm-nyt-pubdate` show strong deviations from the median, suggesting they may be more sensitive to input variations or domain-specific biases. Outliers indicate potential anomalies or edge cases in model behavior. The split plots highlight that while most outputs are balanced around the median, certain categories exhibit skewed distributions, which could impact model reliability in specific applications.
DECODING INTELLIGENCE...