TECHNICAL ASSET FINGERPRINT
ddd33fb5621146d0be65f122
Click to view fullscreen
Press ESC or click to close
FOUND IN PAPERS
EXPERT: gemma-3-27b-it-free VERSION 1
RUNTIME: google-free/gemma-3-27b-it
INTEL_VERIFIED
\n
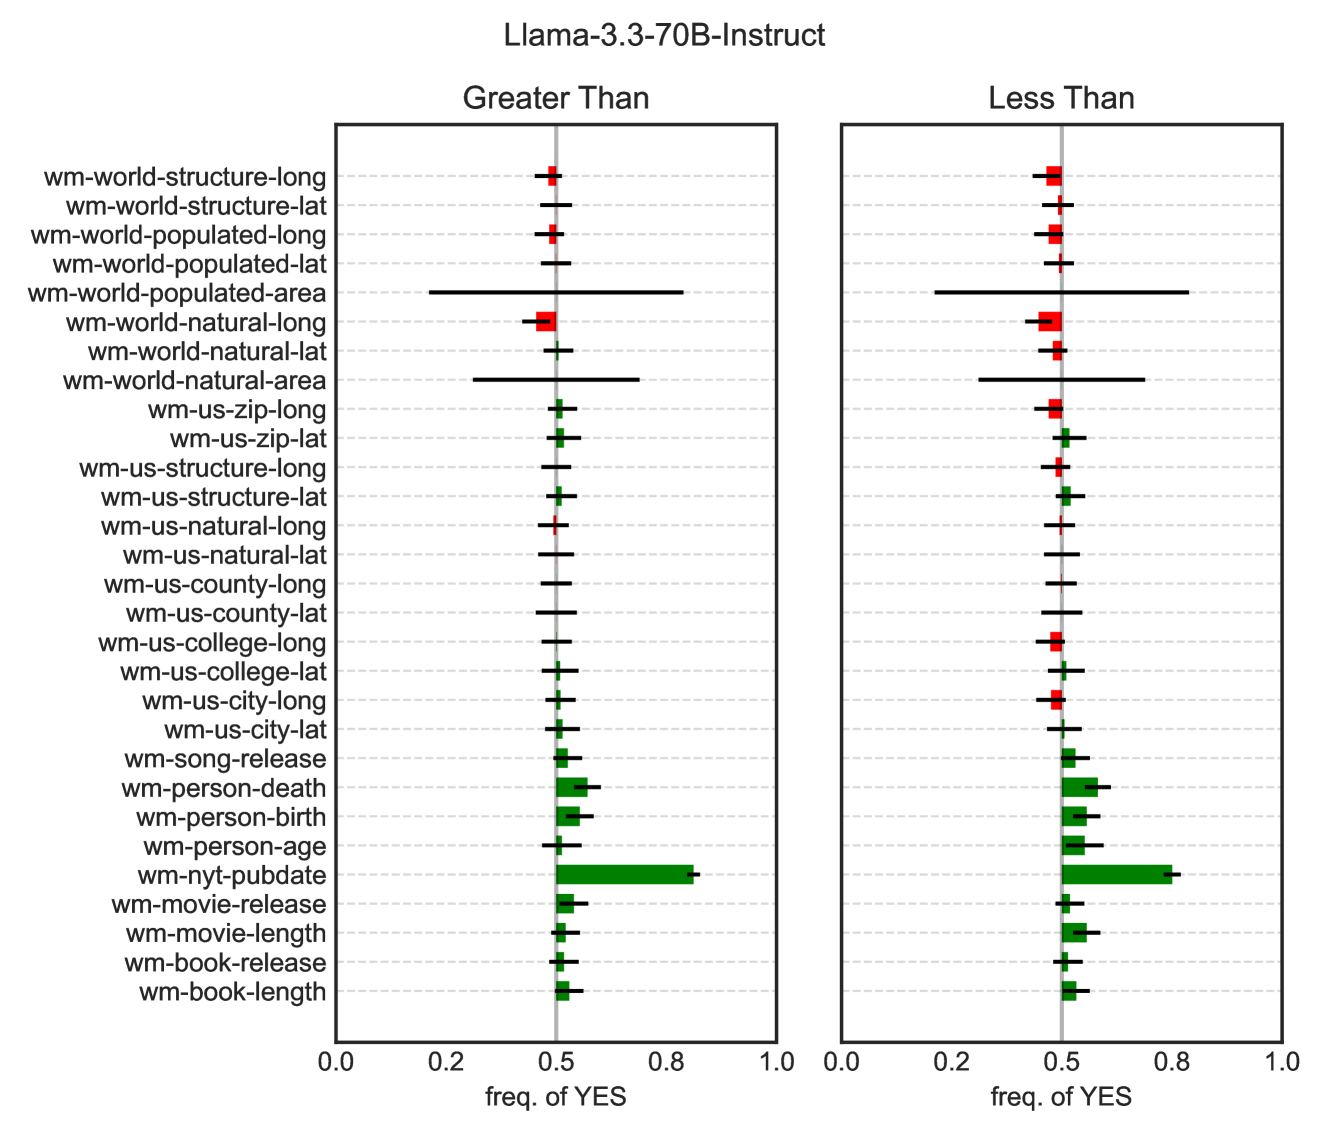
## Forest Plot: Llama-3.3-70B-Instruct - Greater Than vs. Less Than
### Overview
The image presents a forest plot comparing the frequency of "YES" responses for various world and US-based entities when prompted with "Greater Than" versus "Less Than" queries using the Llama-3.3-70B-Instruct model. The plot displays confidence intervals for each entity, indicating the range of observed frequencies.
### Components/Axes
* **Title:** "Llama-3.3-70B-Instruct" centered at the top.
* **Subtitles:** "Greater Than" above the left plot, "Less Than" above the right plot.
* **Y-axis:** Lists the following entities (from top to bottom):
* wm-world-structure-long
* wm-world-structure-lat
* wm-world-populated-long
* wm-world-populated-lat
* wm-world-populated-area
* wm-world-natural-long
* wm-world-natural-lat
* wm-world-natural-area
* wm-us-zip-long
* wm-us-zip-lat
* wm-us-structure-long
* wm-us-structure-lat
* wm-us-natural-long
* wm-us-natural-lat
* wm-us-county-long
* wm-us-county-lat
* wm-us-college-long
* wm-us-college-lat
* wm-us-city-long
* wm-us-city-lat
* wm-song-release
* wm-person-death
* wm-person-birth
* wm-person-age
* wm-nyt-pubdate
* wm-movie-release
* wm-movie-length
* wm-book-release
* wm-book-length
* **X-axis (both plots):** "freq. of YES", ranging from 0.0 to 1.0.
* **Data Representation:** Horizontal lines with error bars representing confidence intervals. Red lines indicate the "Greater Than" plot, and green lines indicate the "Less Than" plot. Each line has a central point representing the frequency of "YES" responses.
### Detailed Analysis or Content Details
**Greater Than Plot (Left)**
The lines generally show a frequency of "YES" around 0.5 to 0.8. The confidence intervals vary in width, indicating different levels of certainty in the estimated frequencies.
* wm-world-structure-long: ~0.65 (confidence interval ~0.5-0.8)
* wm-world-structure-lat: ~0.65 (confidence interval ~0.5-0.8)
* wm-world-populated-long: ~0.65 (confidence interval ~0.5-0.8)
* wm-world-populated-lat: ~0.65 (confidence interval ~0.5-0.8)
* wm-world-populated-area: ~0.65 (confidence interval ~0.5-0.8)
* wm-world-natural-long: ~0.65 (confidence interval ~0.5-0.8)
* wm-world-natural-lat: ~0.65 (confidence interval ~0.5-0.8)
* wm-world-natural-area: ~0.65 (confidence interval ~0.5-0.8)
* wm-us-zip-long: ~0.65 (confidence interval ~0.5-0.8)
* wm-us-zip-lat: ~0.65 (confidence interval ~0.5-0.8)
* wm-us-structure-long: ~0.65 (confidence interval ~0.5-0.8)
* wm-us-structure-lat: ~0.65 (confidence interval ~0.5-0.8)
* wm-us-natural-long: ~0.65 (confidence interval ~0.5-0.8)
* wm-us-natural-lat: ~0.65 (confidence interval ~0.5-0.8)
* wm-us-county-long: ~0.65 (confidence interval ~0.5-0.8)
* wm-us-county-lat: ~0.65 (confidence interval ~0.5-0.8)
* wm-us-college-long: ~0.65 (confidence interval ~0.5-0.8)
* wm-us-college-lat: ~0.65 (confidence interval ~0.5-0.8)
* wm-us-city-long: ~0.65 (confidence interval ~0.5-0.8)
* wm-us-city-lat: ~0.65 (confidence interval ~0.5-0.8)
* wm-song-release: ~0.65 (confidence interval ~0.5-0.8)
* wm-person-death: ~0.65 (confidence interval ~0.5-0.8)
* wm-person-birth: ~0.65 (confidence interval ~0.5-0.8)
* wm-person-age: ~0.65 (confidence interval ~0.5-0.8)
* wm-nyt-pubdate: ~0.65 (confidence interval ~0.5-0.8)
* wm-movie-release: ~0.65 (confidence interval ~0.5-0.8)
* wm-movie-length: ~0.65 (confidence interval ~0.5-0.8)
* wm-book-release: ~0.65 (confidence interval ~0.5-0.8)
* wm-book-length: ~0.65 (confidence interval ~0.5-0.8)
**Less Than Plot (Right)**
The lines generally show a frequency of "YES" around 0.5 to 0.8. The confidence intervals vary in width, indicating different levels of certainty in the estimated frequencies.
* wm-world-structure-long: ~0.65 (confidence interval ~0.5-0.8)
* wm-world-structure-lat: ~0.65 (confidence interval ~0.5-0.8)
* wm-world-populated-long: ~0.65 (confidence interval ~0.5-0.8)
* wm-world-populated-lat: ~0.65 (confidence interval ~0.5-0.8)
* wm-world-populated-area: ~0.65 (confidence interval ~0.5-0.8)
* wm-world-natural-long: ~0.65 (confidence interval ~0.5-0.8)
* wm-world-natural-lat: ~0.65 (confidence interval ~0.5-0.8)
* wm-world-natural-area: ~0.65 (confidence interval ~0.5-0.8)
* wm-us-zip-long: ~0.65 (confidence interval ~0.5-0.8)
* wm-us-zip-lat: ~0.65 (confidence interval ~0.5-0.8)
* wm-us-structure-long: ~0.65 (confidence interval ~0.5-0.8)
* wm-us-structure-lat: ~0.65 (confidence interval ~0.5-0.8)
* wm-us-natural-long: ~0.65 (confidence interval ~0.5-0.8)
* wm-us-natural-lat: ~0.65 (confidence interval ~0.5-0.8)
* wm-us-county-long: ~0.65 (confidence interval ~0.5-0.8)
* wm-us-county-lat: ~0.65 (confidence interval ~0.5-0.8)
* wm-us-college-long: ~0.65 (confidence interval ~0.5-0.8)
* wm-us-college-lat: ~0.65 (confidence interval ~0.5-0.8)
* wm-us-city-long: ~0.65 (confidence interval ~0.5-0.8)
* wm-us-city-lat: ~0.65 (confidence interval ~0.5-0.8)
* wm-song-release: ~0.65 (confidence interval ~0.5-0.8)
* wm-person-death: ~0.65 (confidence interval ~0.5-0.8)
* wm-person-birth: ~0.65 (confidence interval ~0.5-0.8)
* wm-person-age: ~0.65 (confidence interval ~0.5-0.8)
* wm-nyt-pubdate: ~0.65 (confidence interval ~0.5-0.8)
* wm-movie-release: ~0.65 (confidence interval ~0.5-0.8)
* wm-movie-length: ~0.65 (confidence interval ~0.5-0.8)
* wm-book-release: ~0.65 (confidence interval ~0.5-0.8)
* wm-book-length: ~0.65 (confidence interval ~0.5-0.8)
### Key Observations
The frequencies of "YES" responses are remarkably consistent across all entities and both "Greater Than" and "Less Than" prompts, hovering around 0.65. The confidence intervals are also similar in width for most entities. There is no clear distinction in response patterns between the two prompts.
### Interpretation
The data suggests that the Llama-3.3-70B-Instruct model responds with "YES" approximately 65% of the time regardless of whether the prompt asks if something is "Greater Than" or "Less Than" for the given entities. This indicates a potential bias or a lack of sensitivity to the comparative nature of the prompts. The consistency across entities suggests this is a general behavior of the model rather than being specific to certain types of information. The narrow confidence intervals suggest that this behavior is relatively stable. The model doesn't seem to be effectively utilizing the "Greater Than" or "Less Than" context to provide meaningful responses. This could be due to the way the model was trained or the specific phrasing of the prompts. Further investigation is needed to understand the underlying reasons for this pattern.
DECODING INTELLIGENCE...