## Box Plot: Llama-3.3-70B-Instruct Response Frequency Distribution
### Overview
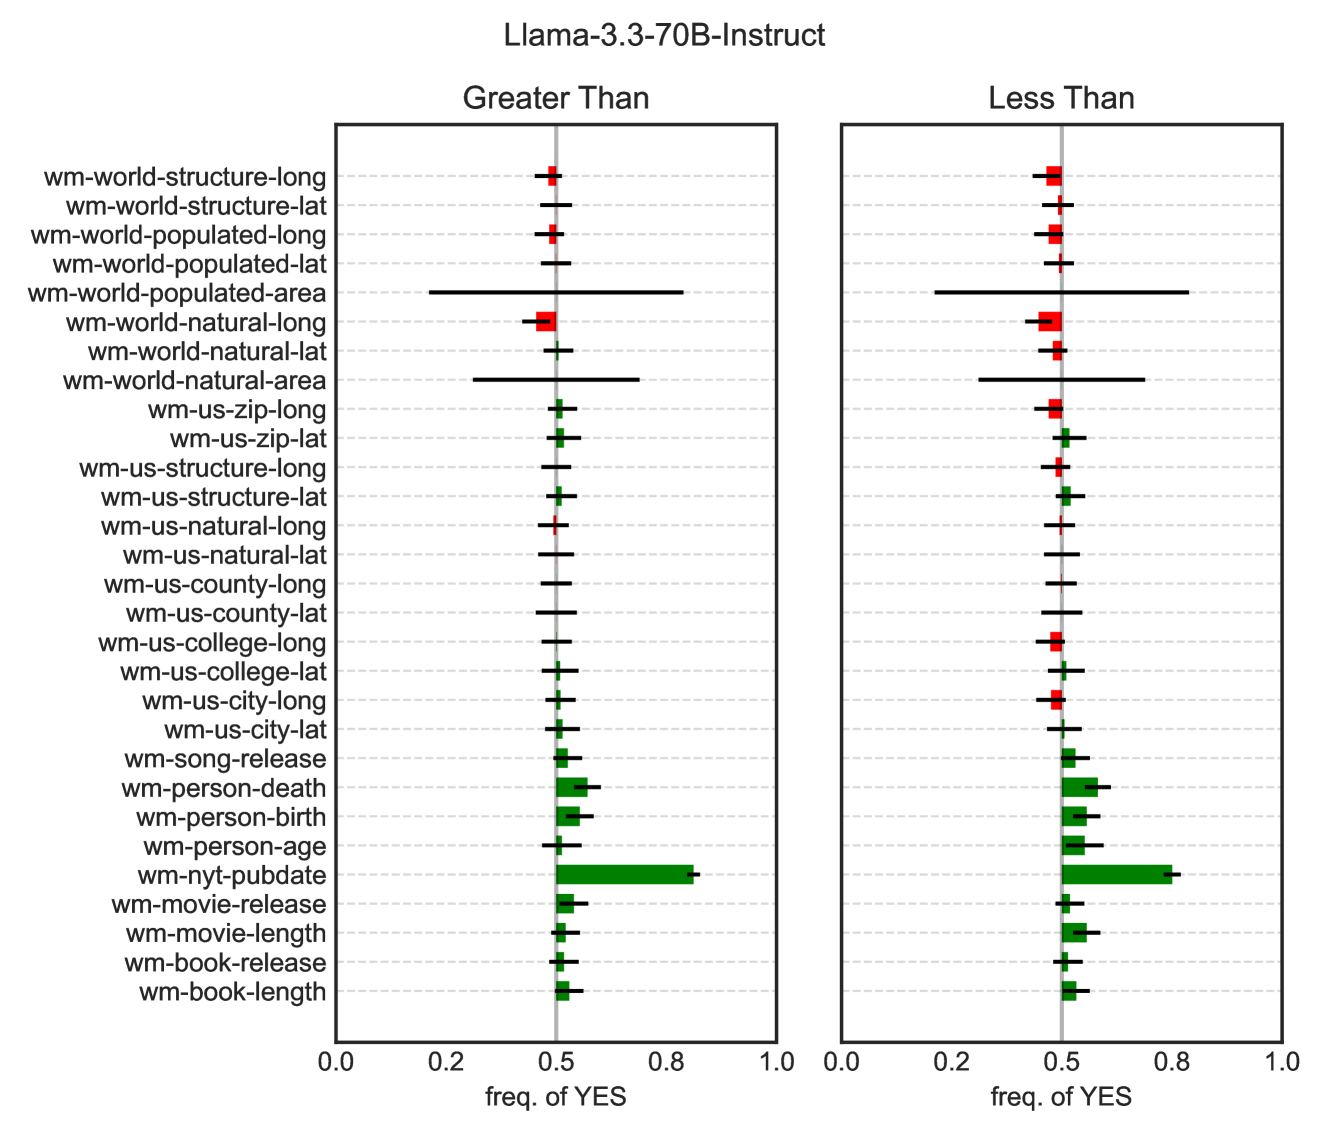
The image shows two side-by-side box plots comparing the frequency of "YES" responses for various Llama-3.3-70B-Instruct model outputs. The plots are divided into "Greater Than" (median) and "Less Than" (median) categories, with categories listed on the y-axis and frequency values (0-1.0) on the x-axis.
### Components/Axes
- **Title**: "Llama-3.3-70B-Instruct"
- **Subplots**:
- Left: "Greater Than" (median)
- Right: "Less Than" (median)
- **Y-Axis**: Categories (model outputs) listed vertically:
- `wm-world-structure-long`, `wm-world-structure-lat`, `wm-world-populated-long`, `wm-world-populated-lat`, `wm-world-populated-area`, `wm-world-natural-long`, `wm-world-natural-lat`, `wm-world-natural-area`, `wm-us-zip-long`, `wm-us-zip-lat`, `wm-us-structure-long`, `wm-us-structure-lat`, `wm-us-natural-long`, `wm-us-natural-lat`, `wm-us-county-long`, `wm-us-county-lat`, `wm-us-college-long`, `wm-us-college-lat`, `wm-us-city-long`, `wm-us-city-lat`, `wm-song-release`, `wm-person-death`, `wm-person-birth`, `wm-person-age`, `wm-nyt-pubdate`, `wm-movie-release`, `wm-movie-length`, `wm-book-release`, `wm-book-length`
- **X-Axis**: "freq. of YES" (0.0 to 1.0)
- **Legend**:
- Red: "Greater Than" (median)
- Green: "Less Than" (median)
- **Axis Markers**: Dotted grid lines at 0.0, 0.2, 0.4, 0.6, 0.8, 1.0
### Detailed Analysis
#### Left Plot ("Greater Than" Median)
- **Median Line**: Vertical line at ~0.5 for most categories.
- **Key Categories**:
- `wm-world-populated-area`: Red box spans ~0.5–0.7 (median ~0.6).
- `wm-nyt-pubdate`: Red box spans ~0.7–0.9 (median ~0.8).
- `wm-movie-release`: Red box spans ~0.6–0.8 (median ~0.7).
- **Outliers**:
- `wm-nyt-pubdate` and `wm-movie-release` show outliers above 0.9.
#### Right Plot ("Less Than" Median)
- **Median Line**: Vertical line at ~0.5 for most categories.
- **Key Categories**:
- `wm-world-populated-area`: Green box spans ~0.3–0.5 (median ~0.4).
- `wm-nyt-pubdate`: Green box spans ~0.1–0.3 (median ~0.2).
- `wm-person-age`: Green box spans ~0.4–0.6 (median ~0.5).
- **Outliers**:
- `wm-person-age` and `wm-nyt-pubdate` show outliers below 0.1.
### Key Observations
1. **Median Consistency**: Most categories cluster around the 0.5 median line, indicating balanced "YES" response frequencies.
2. **High Variability**:
- `wm-nyt-pubdate` and `wm-movie-release` show significant outliers in the "Greater Than" plot.
- `wm-person-age` and `wm-nyt-pubdate` show outliers in the "Less Than" plot.
3. **Category-Specific Trends**:
- `wm-world-populated-area` has the highest median in "Greater Than" (~0.6) and lowest in "Less Than" (~0.4).
- `wm-nyt-pubdate` exhibits the largest spread in both plots.
### Interpretation
The chart reveals how different model outputs vary in their likelihood of generating "YES" responses. Categories like `wm-world-populated-area` and `wm-nyt-pubdate` show strong deviations from the median, suggesting they may be more sensitive to input variations or domain-specific biases. Outliers indicate potential anomalies or edge cases in model behavior. The split plots highlight that while most outputs are balanced around the median, certain categories exhibit skewed distributions, which could impact model reliability in specific applications.