## Diagram: Model Accuracy on State Border Question
### Overview
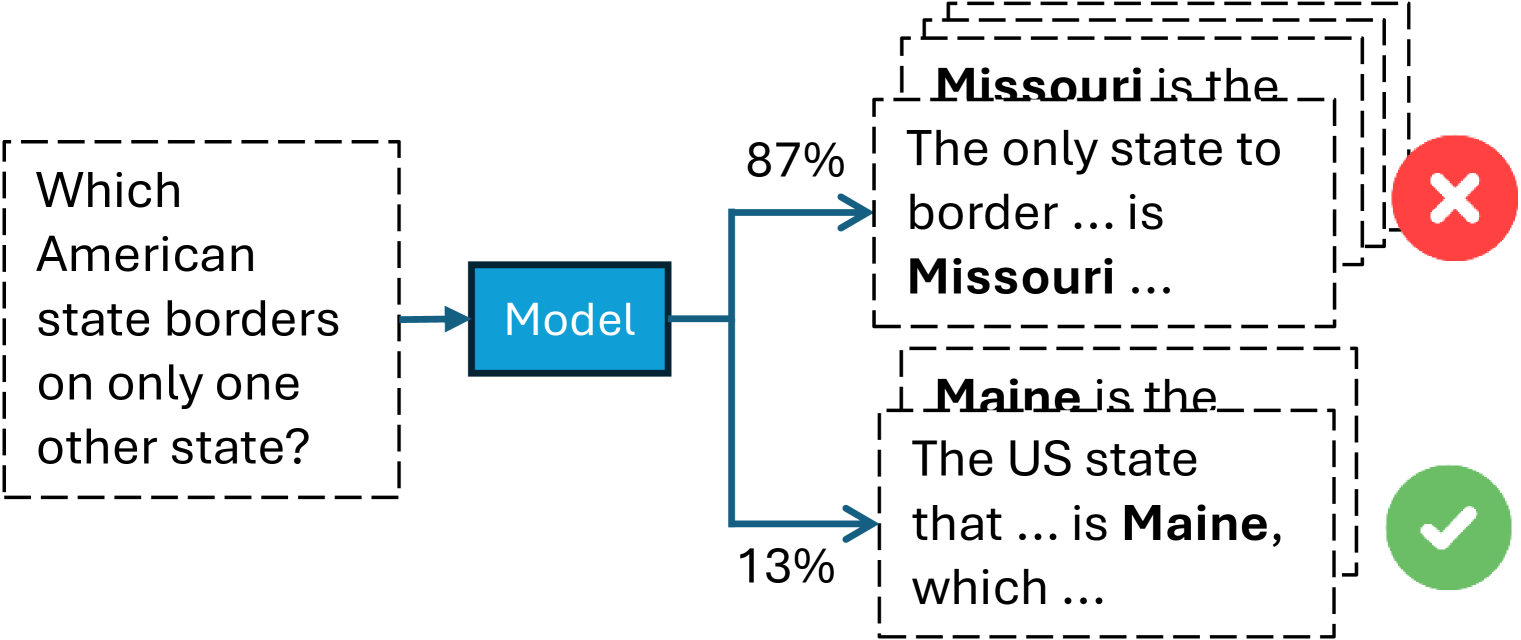
The image is a diagram illustrating the accuracy of a model in answering the question: "Which American state borders on only one other state?". The diagram shows the model's output, the percentage of times each output was given, and whether the output was correct or incorrect.
### Components/Axes
* **Input Question:** "Which American state borders on only one other state?" (contained in a dashed-line box on the left)
* **Model:** A blue rectangle labeled "Model" in the center.
* **Output 1:** "Missouri is the. The only state to border ... is Missouri ..." (contained in a dashed-line box on the right, top). This output is marked with a red "X", indicating it is incorrect.
* **Output 2:** "Maine is the. The US state that ... is Maine, which ..." (contained in a dashed-line box on the right, bottom). This output is marked with a green checkmark, indicating it is correct.
* **Percentages:**
* 87% associated with the "Missouri" output.
* 13% associated with the "Maine" output.
### Detailed Analysis
* The model incorrectly identifies Missouri as the state bordering only one other state 87% of the time.
* The model correctly identifies Maine as the state bordering only one other state 13% of the time.
* The diagram uses a blue arrow to indicate the flow from the input question to the model and from the model to the outputs.
### Key Observations
* The model is significantly more likely to provide the incorrect answer (Missouri) than the correct answer (Maine).
* The model's accuracy is low, with only 13% of responses being correct.
### Interpretation
The diagram demonstrates that the model performs poorly on the given question. The high percentage of incorrect answers suggests that the model may be biased towards Missouri or lacks the necessary information to accurately answer the question. The diagram highlights the need for improvement in the model's ability to identify states based on their bordering states.