## Line Chart: R1-Qwen | AIME24
### Overview
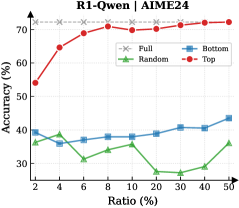
The chart compares the accuracy (%) of four data series ("Full," "Bottom," "Random," "Top") across varying ratios (%) from 2% to 50%. The y-axis represents accuracy (30–70%), and the x-axis represents ratio (%) with non-linear spacing (2, 4, 6, 8, 10, 20, 30, 40, 50). The legend is positioned in the top-right corner, with colors matching the data series.
### Components/Axes
- **X-axis (Ratio %)**: Labeled "Ratio (%)" with markers at 2, 4, 6, 8, 10, 20, 30, 40, 50.
- **Y-axis (Accuracy %)**: Labeled "Accuracy (%)" with markers at 30, 40, 50, 60, 70.
- **Legend**: Top-right corner, with labels:
- Gray dashed line: "Full"
- Blue solid line: "Bottom"
- Green solid line: "Random"
- Red solid line: "Top"
### Detailed Analysis
1. **Top (Red Solid Line)**:
- Starts at ~55% accuracy at 2% ratio.
- Sharp upward trend to ~70% by 8% ratio.
- Plateaus near 70% from 10% to 50% ratio.
- Key data points:
- 2%: ~55%
- 4%: ~65%
- 6%: ~68%
- 8%: ~70%
- 10%–50%: ~70%
2. **Full (Gray Dashed Line)**:
- Flat line at ~70% accuracy across all ratios.
- No visible variation.
3. **Bottom (Blue Solid Line)**:
- Starts at ~40% accuracy at 2% ratio.
- Slight dip to ~38% at 4% ratio.
- Gradual rise to ~45% by 50% ratio.
- Key data points:
- 2%: ~40%
- 4%: ~38%
- 6%: ~39%
- 8%: ~39%
- 10%: ~39%
- 20%: ~40%
- 30%: ~42%
- 40%: ~43%
- 50%: ~45%
4. **Random (Green Solid Line)**:
- Highly fluctuating, with peaks and troughs.
- Peaks at ~38% (4% ratio) and ~35% (50% ratio).
- Lowest point at ~28% (20% ratio).
- Key data points:
- 2%: ~36%
- 4%: ~38%
- 6%: ~32%
- 8%: ~34%
- 10%: ~36%
- 20%: ~28%
- 30%: ~29%
- 40%: ~30%
- 50%: ~35%
### Key Observations
- **Top and Full** achieve the highest accuracy, with Top showing rapid improvement at lower ratios and Full maintaining consistent performance.
- **Bottom** demonstrates a steady but modest improvement as ratio increases.
- **Random** exhibits erratic behavior, with no clear trend and significant dips (e.g., 20% ratio).
- **Diminishing Returns**: Top and Full plateau near 70% accuracy after 8–10% ratio, suggesting limited gains beyond this point.
### Interpretation
The data suggests that higher ratios (Top/Full) correlate with improved accuracy, while Random’s inconsistency implies lower reliability. The sharp rise in Top’s accuracy at lower ratios (2%–8%) indicates efficiency gains in early stages, but performance stabilizes afterward. Bottom’s gradual improvement highlights potential for scalability, whereas Random’s volatility underscores the need for structured approaches. The plateau in Top and Full implies that beyond 10% ratio, additional resources yield minimal accuracy improvements, pointing to possible optimization opportunities.