## Bar Chart: GPU Kernel Speedup vs CPU Baseline
### Overview
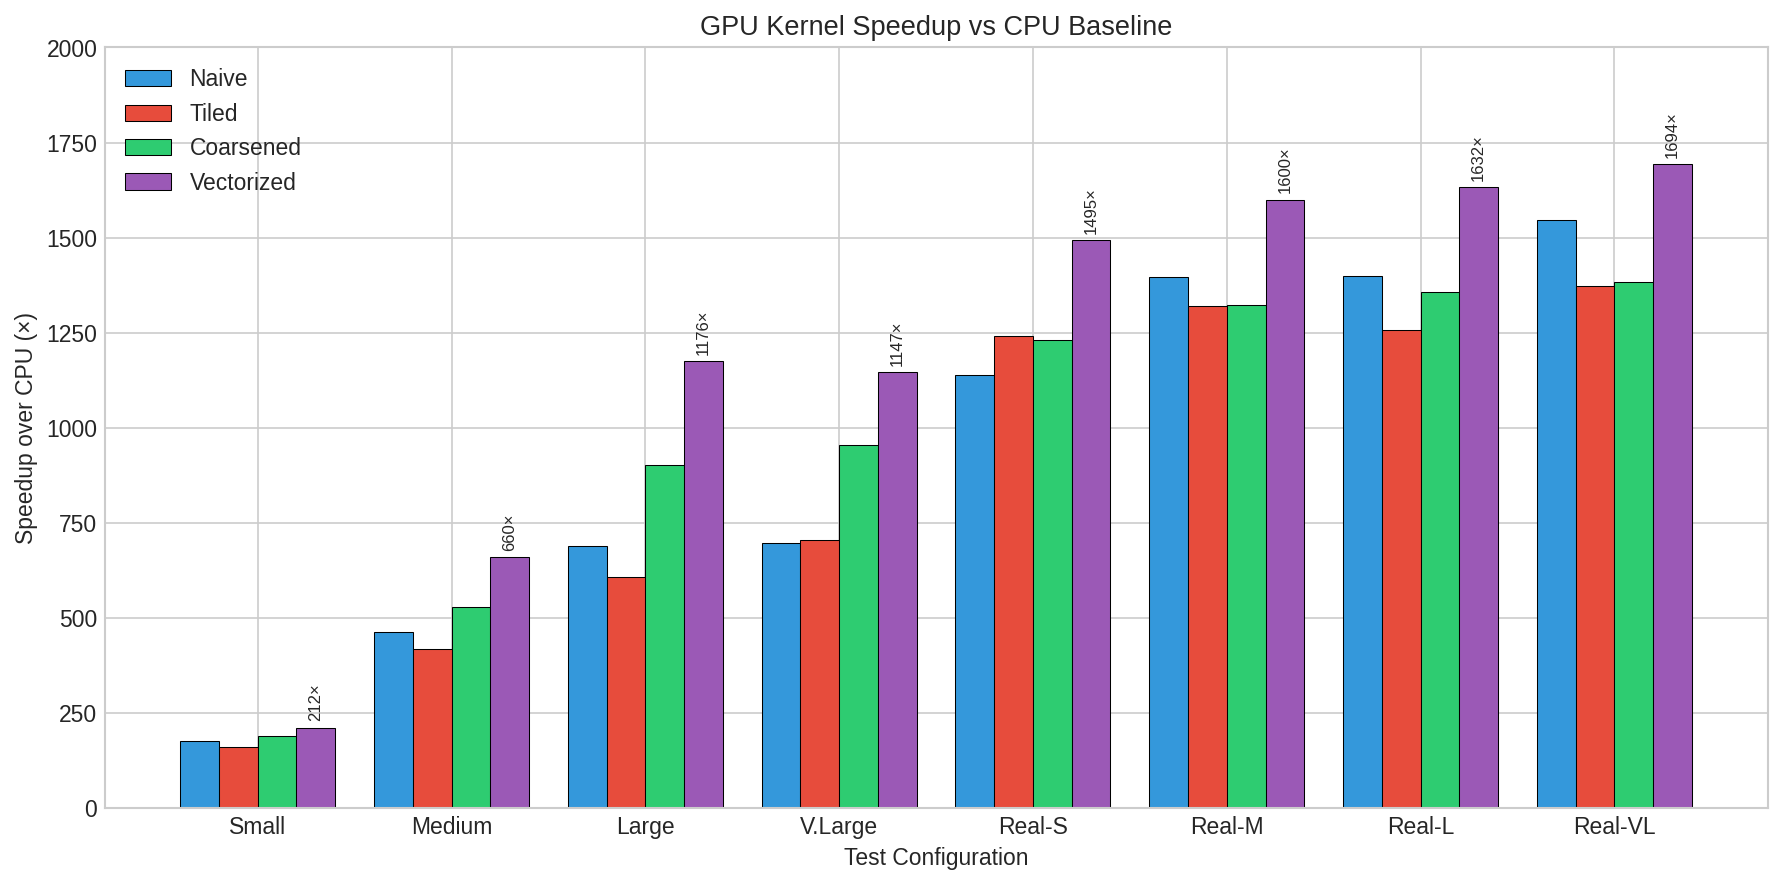
The chart compares GPU kernel speedup relative to CPU baseline performance across eight test configurations (Small to Real-VL). Four kernel optimization strategies are visualized: Naive (blue), Tiled (red), Coarsened (green), and Vectorized (purple). Speedup values are represented as multiples of CPU performance (x-axis).
### Components/Axes
- **X-axis**: Test Configuration categories (Small, Medium, Large, V.Large, Real-S, Real-M, Real-L, Real-VL)
- **Y-axis**: Speedup over CPU (x) with logarithmic scale (0–2000)
- **Legend**: Located in top-left corner with color-coded labels:
- Naive: Blue
- Tiled: Red
- Coarsened: Green
- Vectorized: Purple
- **Bar Groups**: Four bars per configuration, grouped by optimization strategy
### Detailed Analysis
1. **Small Configuration**
- Naive: ~200x
- Tiled: ~150x
- Coarsened: ~200x
- Vectorized: ~250x
2. **Medium Configuration**
- Naive: ~450x
- Tiled: ~400x
- Coarsened: ~500x
- Vectorized: ~700x
3. **Large Configuration**
- Naive: ~700x
- Tiled: ~600x
- Coarsened: ~900x
- Vectorized: ~1200x
4. **V.Large Configuration**
- Naive: ~700x
- Tiled: ~700x
- Coarsened: ~950x
- Vectorized: ~1150x
5. **Real-S Configuration**
- Naive: ~1100x
- Tiled: ~1250x
- Coarsened: ~1200x
- Vectorized: ~1500x
6. **Real-M Configuration**
- Naive: ~1400x
- Tiled: ~1300x
- Coarsened: ~1300x
- Vectorized: ~1600x
7. **Real-L Configuration**
- Naive: ~1400x
- Tiled: ~1250x
- Coarsened: ~1350x
- Vectorized: ~1650x
8. **Real-VL Configuration**
- Naive: ~1550x
- Tiled: ~1350x
- Coarsened: ~1400x
- Vectorized: ~1700x
### Key Observations
1. **Vectorized Dominance**: Purple bars consistently show highest speedup across all configurations, with Real-VL reaching ~1700x
2. **Scaling Pattern**: Speedup increases with configuration size, particularly pronounced in Vectorized kernels
3. **Tiled vs Naive**: Tiled kernels outperform Naive in all configurations except Small
4. **Coarsened Performance**: Green bars show mid-range performance, often between Tiled and Vectorized
5. **Logarithmic Scale**: Y-axis compression emphasizes relative differences in speedup
### Interpretation
The data demonstrates that vectorized GPU kernels achieve significantly higher performance gains compared to other optimization strategies, with the advantage becoming more pronounced in larger configurations. This suggests that vectorization becomes increasingly effective as problem complexity grows. The Real-VL configuration shows the most dramatic speedup (1700x), indicating that vectorized implementations scale exceptionally well for very large workloads. While Tiled and Coarsened approaches show moderate improvements over Naive implementations, their performance plateaus at lower multiples compared to Vectorized kernels. The consistent pattern across all configurations reinforces the conclusion that vectorization is the most effective optimization strategy for GPU kernel performance relative to CPU baselines.