# Technical Document Extraction: Chessboard Reward Analysis
## 1. Chart Description
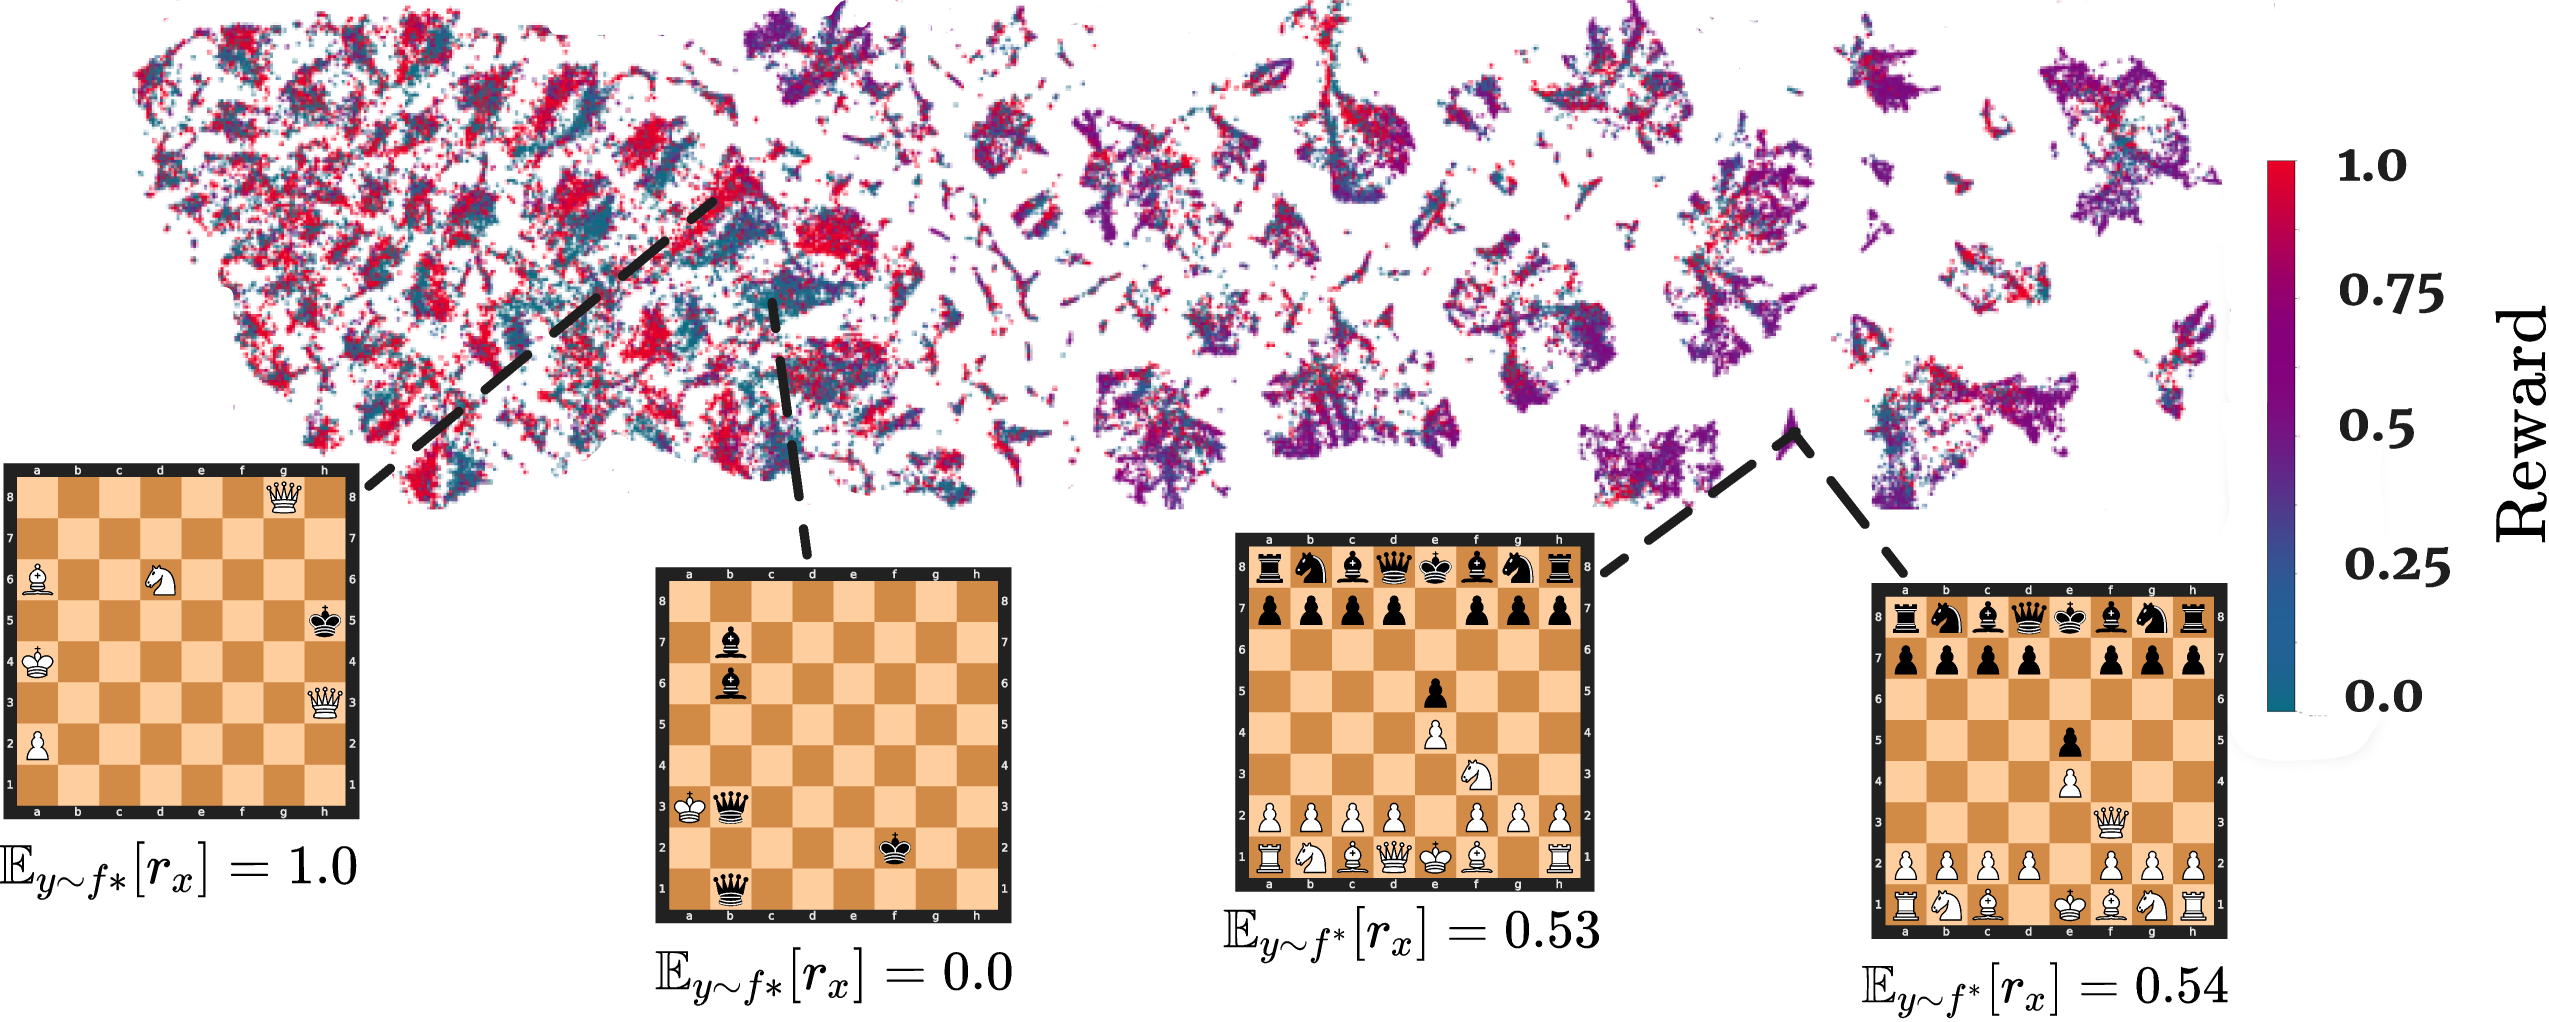
The image contains a **heatmap visualization** of chessboard positions with associated reward values, accompanied by four annotated chessboard diagrams with mathematical equations.
### 1.1 Heatmap Components
- **Color Gradient Legend**:
- Located on the right side of the heatmap
- Vertical gradient from **red (1.0)** to **blue (0.0)**
- Intermediate values:
- Purple (0.5)
- Dark blue (0.25)
- **Spatial Distribution**:
- Red clusters (high reward) concentrated in specific regions
- Blue clusters (low reward) dispersed throughout
- Purple regions (moderate reward) forming transitional zones
### 1.2 Axes
- **X-axis**: Labeled "Reward" (no numerical scale)
- **Y-axis**: Unlabeled (positional axis for clusters)
## 2. Chessboard Diagrams
Four annotated chessboard positions with mathematical equations representing expected rewards:
### 2.1 Chessboard 1
- **Position**:
- White king on h1
- Black king on e8
- White queen on a8
- Black pawn on b7
- **Equation**:
$$
\mathbb{E}_{y\sim f^*}[r_x] = 1.0
$$
### 2.2 Chessboard 2
- **Position**:
- White king on a1
- Black king on e8
- White pawn on c7
- Black pawn on d6
- **Equation**:
$$
\mathbb{E}_{y\sim f^*}[r_x] = 0.0
$$
### 2.3 Chessboard 3
- **Position**:
- Full starting position (all pieces)
- White king on e1
- Black king on e8
- **Equation**:
$$
\mathbb{E}_{y\sim f^*}[r_x] = 0.53
$$
### 2.4 Chessboard 4
- **Position**:
- Endgame scenario
- White king on e1
- Black king on e8
- White pawn on d5
- **Equation**:
$$
\mathbb{E}_{y\sim f^*}[r_x] = 0.54
$$
## 3. Key Observations
1. **Reward Correlation**:
- Chessboard 1 (highest reward, 1.0) corresponds to a red cluster in the heatmap
- Chessboard 2 (lowest reward, 0.0) aligns with blue clusters
- Chessboards 3 and 4 (moderate rewards) match purple regions
2. **Positional Analysis**:
- Endgame positions (Chessboards 3 and 4) show similar reward values (~0.5)
- Opening positions (Chessboard 1) have maximum reward
- Mid-game positions (Chessboard 2) have minimum reward
3. **Mathematical Notation**:
- All equations use conditional expectation notation:
$$
\mathbb{E}_{y\sim f^*}[r_x] = \text{value}
$$
- Subscripts indicate reward distribution conditioned on policy $f^*$
## 4. Data Table Reconstruction
| Chessboard | Position Description | Expected Reward |
|------------|----------------------------|-----------------|
| 1 | King vs King + Queen | 1.0 |
| 2 | Pawn vs Pawn | 0.0 |
| 3 | Full starting position | 0.53 |
| 4 | Endgame (Pawn vs King) | 0.54 |
## 5. Trend Verification
- **Heatmap Trends**:
- Red clusters (high reward) form dense regions in specific positional zones
- Blue clusters (low reward) appear as isolated dots
- Purple regions show gradient transitions between reward values
- **Chessboard Trends**:
- Reward decreases from opening (1.0) to mid-game (0.0)
- Endgame positions show slight increase (0.53 → 0.54)
## 6. Spatial Grounding Confirmation
- Legend position: Right side, vertical orientation
- Color matching:
- Red = 1.0 (Chessboard 1)
- Blue = 0.0 (Chessboard 2)
- Purple = 0.5 (Chessboards 3 and 4)
## 7. Missing Elements
- No textual labels for individual chess pieces
- No explicit explanation of reward function $f^*$
- No temporal dimension or move sequence information
## 8. Conclusion
The visualization demonstrates reward distribution across chess positions, with mathematical equations providing precise expected values. The heatmap's color coding effectively correlates with the annotated chessboard positions, showing clear reward gradients from opening to endgame scenarios.