\n
## Bar Chart: Prediction Flip Rate for Llama-3.2-1B
### Overview
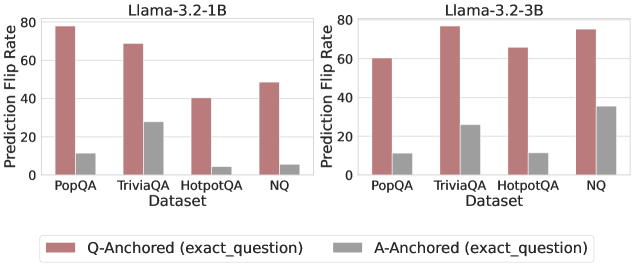
The image presents two identical bar charts comparing the "Prediction Flip Rate" for the Llama-3.2-1B model across four datasets: PopQA, TriviaQA, HotpotQA, and NQ. The flip rate is measured for two anchoring methods: "Q-Anchored (exact_question)" and "A-Anchored (exact_question)". Each chart displays the flip rate as a function of the dataset, with separate bars for each anchoring method within each dataset.
### Components/Axes
* **Title:** "Llama-3.2-1B" (appears above each chart)
* **X-axis:** "Dataset" with categories: PopQA, TriviaQA, HotpotQA, NQ.
* **Y-axis:** "Prediction Flip Rate" with a scale ranging from 0 to 80.
* **Legend:** Located at the bottom-center of the image.
* "Q-Anchored (exact\_question)" - represented by a reddish-brown color.
* "A-Anchored (exact\_question)" - represented by a gray color.
### Detailed Analysis
**Chart 1:**
* **PopQA:**
* Q-Anchored: Approximately 80.
* A-Anchored: Approximately 10.
* **TriviaQA:**
* Q-Anchored: Approximately 70.
* A-Anchored: Approximately 30.
* **HotpotQA:**
* Q-Anchored: Approximately 45.
* A-Anchored: Approximately 15.
* **NQ:**
* Q-Anchored: Approximately 50.
* A-Anchored: Approximately 35.
**Chart 2:** (Identical to Chart 1)
* **PopQA:**
* Q-Anchored: Approximately 80.
* A-Anchored: Approximately 10.
* **TriviaQA:**
* Q-Anchored: Approximately 70.
* A-Anchored: Approximately 30.
* **HotpotQA:**
* Q-Anchored: Approximately 45.
* A-Anchored: Approximately 15.
* **NQ:**
* Q-Anchored: Approximately 50.
* A-Anchored: Approximately 35.
The Q-Anchored bars consistently show higher flip rates than the A-Anchored bars across all datasets. The Q-Anchored flip rate is highest for PopQA and TriviaQA, and lower for HotpotQA and NQ. The A-Anchored flip rate is relatively consistent across all datasets, ranging from approximately 10 to 35.
### Key Observations
* The Q-Anchored method consistently results in a significantly higher prediction flip rate compared to the A-Anchored method.
* The PopQA and TriviaQA datasets exhibit the highest flip rates for the Q-Anchored method.
* The A-Anchored method shows a relatively stable flip rate across all datasets.
* The two charts are identical, suggesting a replication or confirmation of the results.
### Interpretation
The data suggests that anchoring predictions using the exact question ("Q-Anchored") leads to a higher rate of prediction flips compared to anchoring with the exact answer ("A-Anchored") for the Llama-3.2-1B model. This could indicate that the model is more sensitive to variations in the question phrasing than variations in the answer. The higher flip rates observed for PopQA and TriviaQA might suggest that these datasets are more challenging for the model, or that the model's initial predictions are less confident on these datasets. The relatively stable flip rate for the A-Anchored method suggests that the model is more consistent in its predictions when anchored to the answer. The duplication of the charts implies a robustness check, reinforcing the observed trends. The "Prediction Flip Rate" likely refers to the percentage of times the model changes its prediction when presented with slightly different inputs (e.g., rephrased questions or answers).