## Grouped Bar Chart: Prediction Flip Rates by Dataset and Anchoring Method
### Overview
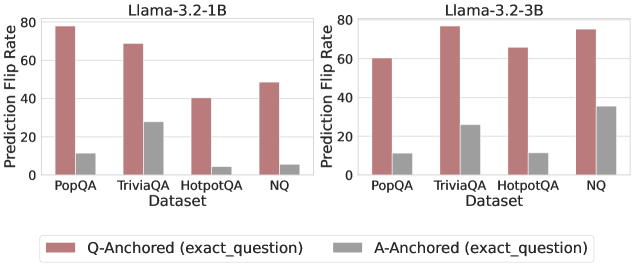
The image displays two side-by-side grouped bar charts comparing the "Prediction Flip Rate" for two different model sizes (Llama-3.2-1B and Llama-3.2-3B) across four question-answering datasets. The charts evaluate the effect of two anchoring methods: "Q-Anchored (exact_question)" and "A-Anchored (exact_question)".
### Components/Axes
- **Chart Titles:**
- Left Chart: `Llama-3.2-1B`
- Right Chart: `Llama-3.2-3B`
- **Y-Axis (Both Charts):**
- Label: `Prediction Flip Rate`
- Scale: Linear, from 0 to 80, with major tick marks at 0, 20, 40, 60, 80.
- **X-Axis (Both Charts):**
- Label: `Dataset`
- Categories (from left to right): `PopQA`, `TriviaQA`, `HotpotQA`, `NQ`.
- **Legend (Bottom Center, spanning both charts):**
- Reddish-brown bar: `Q-Anchored (exact_question)`
- Gray bar: `A-Anchored (exact_question)`
### Detailed Analysis
**Chart 1: Llama-3.2-1B**
- **Trend Verification:** For all four datasets, the Q-Anchored (reddish-brown) bar is significantly taller than the A-Anchored (gray) bar, indicating a higher flip rate.
- **Data Points (Approximate Values):**
- **PopQA:**
- Q-Anchored: ~78
- A-Anchored: ~10
- **TriviaQA:**
- Q-Anchored: ~69
- A-Anchored: ~28
- **HotpotQA:**
- Q-Anchored: ~40
- A-Anchored: ~5
- **NQ:**
- Q-Anchored: ~49
- A-Anchored: ~6
**Chart 2: Llama-3.2-3B**
- **Trend Verification:** The same pattern holds: Q-Anchored bars are consistently taller than A-Anchored bars across all datasets.
- **Data Points (Approximate Values):**
- **PopQA:**
- Q-Anchored: ~60
- A-Anchored: ~11
- **TriviaQA:**
- Q-Anchored: ~77
- A-Anchored: ~27
- **HotpotQA:**
- Q-Anchored: ~66
- A-Anchored: ~11
- **NQ:**
- Q-Anchored: ~76
- A-Anchored: ~36
### Key Observations
1. **Consistent Dominance of Q-Anchoring:** In every single comparison (8 out of 8), the Q-Anchored method results in a higher Prediction Flip Rate than the A-Anchored method.
2. **Dataset Variability:** The magnitude of the flip rate varies by dataset. For the 1B model, PopQA shows the highest Q-Anchored flip rate (~78), while HotpotQA shows the lowest (~40). For the 3B model, TriviaQA and NQ show the highest Q-Anchored rates (~77, ~76).
3. **Model Size Effect:** Comparing the two charts, the 3B model generally shows higher flip rates for the Q-Anchored method on three of the four datasets (TriviaQA, HotpotQA, NQ), with the most dramatic increase on HotpotQA (from ~40 to ~66). The A-Anchored rates also show a moderate increase for the 3B model, most notably on NQ (from ~6 to ~36).
4. **Relative Gap:** The absolute difference between the two anchoring methods is largest for PopQA in the 1B model (~68 points) and smallest for NQ in the 3B model (~40 points).
### Interpretation
This data suggests a strong and consistent effect of the anchoring method on model behavior. "Prediction Flip Rate" likely measures how often a model changes its answer when presented with a specific piece of information (the "anchor").
- **Q-Anchored (exact_question):** Providing the exact question as an anchor leads to a high rate of answer changes. This implies the model's initial answer is highly sensitive to re-evaluation when the question is explicitly restated, possibly due to re-contextualization or triggering different retrieval pathways.
- **A-Anchored (exact_question):** Providing the exact answer as an anchor results in a much lower flip rate. This suggests that when the model is given the answer directly, it is more likely to stick with that answer, demonstrating a form of confirmation bias or anchoring effect where the provided answer heavily influences the final output.
- **Model Scaling:** The increase in flip rates for the larger (3B) model, particularly for Q-Anchoring, could indicate that larger models are more sensitive to contextual cues or have more volatile reasoning processes that are easily redirected by new information.
- **Practical Implication:** For tasks requiring robust and consistent answers, anchoring with the answer (A-Anchored) appears to produce more stable outputs. Conversely, if the goal is to explore alternative answers or stress-test a model's reasoning, Q-Anchoring is a more effective perturbation. The choice of dataset also significantly impacts the magnitude of this effect.