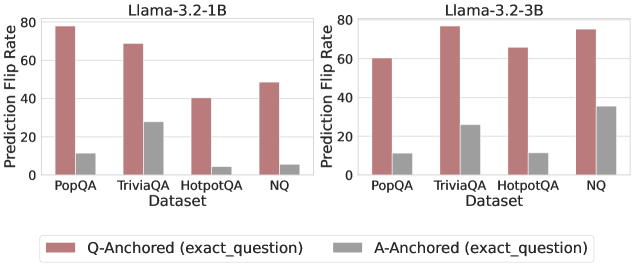
## Bar Chart: Prediction Flip Rate Comparison for Llama-3.2 Models
### Overview
The image presents a comparative bar chart analyzing prediction flip rates for two versions of the Llama-3.2 model (1B and 3B parameter sizes) across four question-answering datasets: PopQA, TriviaQA, HotpotQA, and NQ. Two anchoring strategies are compared: Q-Anchored (exact_question) and A-Anchored (exact_question), represented by red and gray bars respectively.
### Components/Axes
- **X-Axis (Datasets)**: PopQA, TriviaQA, HotpotQA, NQ (left to right)
- **Y-Axis (Prediction Flip Rate)**: Scaled from 0 to 80
- **Legend**:
- Red = Q-Anchored (exact_question)
- Gray = A-Anchored (exact_question)
- **Model Versions**:
- Left section = Llama-3.2-1B
- Right section = Llama-3.2-3B
### Detailed Analysis
#### Llama-3.2-1B (Left Section)
| Dataset | Q-Anchored (exact_question) | A-Anchored (exact_question) |
|--------------|-----------------------------|-----------------------------|
| PopQA | ~78 | ~12 |
| TriviaQA | ~68 | ~28 |
| HotpotQA | ~40 | ~4 |
| NQ | ~48 | ~6 |
#### Llama-3.2-3B (Right Section)
| Dataset | Q-Anchored (exact_question) | A-Anchored (exact_question) |
|--------------|-----------------------------|-----------------------------|
| PopQA | ~60 | ~12 |
| TriviaQA | ~76 | ~26 |
| HotpotQA | ~66 | ~12 |
| NQ | ~76 | ~35 |
### Key Observations
1. **Q-Anchored Dominance**: Q-Anchored (red) consistently outperforms A-Anchored (gray) across all datasets and models, with flip rates 3-5x higher.
2. **Model Size Impact**: Llama-3.2-3B shows significantly higher Q-Anchored rates than 1B in PopQA (+20%), TriviaQA (+12%), and NQ (+56%), but underperforms in HotpotQA (-14%).
3. **A-Anchored Anomaly**: NQ dataset shows a 483% increase in A-Anchored flip rate for 3B vs 1B (6 → 35), contradicting the general trend of lower A-Anchored performance.
4. **Dataset Variance**: HotpotQA exhibits the largest gap between anchoring strategies (36 percentage points for 1B, 54 for 3B).
### Interpretation
The data demonstrates that Q-Anchored methods leverage model capabilities more effectively than A-Anchored approaches, with larger models (3B) showing stronger performance gains. The NQ dataset's anomalous A-Anchored improvement for 3B suggests potential dataset-specific interactions with model architecture. While Q-Anchored benefits from increased parameter count, the HotpotQA underperformance in 3B warrants investigation into dataset-model compatibility. The consistent Q-Anchored superiority across datasets indicates that question-specific anchoring provides more reliable performance than answer-based anchoring, though the NQ exception highlights the need for further analysis of edge cases in question-answering benchmarks.