# Technical Document Extraction: Weight of Winning Dog at a Dog Show
## Header Section
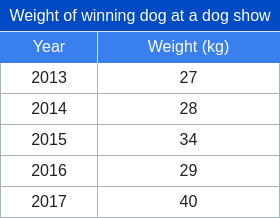
**Title:** Weight of winning dog at a dog show
**Format:** Tabular data table with two columns
## Main Chart Component
### Table Structure
| Year | Weight (kg) |
|------|-------------|
| 2013 | 27 |
| 2014 | 28 |
| 2015 | 34 |
| 2016 | 29 |
| 2017 | 40 |
### Key Trends and Data Points
1. **Initial Increase (2013-2015):**
- 2013: 27 kg
- 2014: +1 kg (28 kg)
- 2015: +6 kg (34 kg)
*Trend:* Steady upward trajectory with significant jump in 2015.
2. **Temporary Decline (2016):**
- 2016: -5 kg (29 kg)
*Trend:* First decrease after three years of growth.
3. **Final Surge (2017):**
- 2017: +11 kg (40 kg)
*Trend:* Sharp rebound to highest recorded weight.
### Spatial Grounding
- **Legend:** Not applicable (no color-coded data series).
- **Axis Titles:**
- X-axis: `Year` (categorical, 2013–2017)
- Y-axis: `Weight (kg)` (numerical, 27–40 kg)
### Trend Verification
- **Visual Confirmation:**
- Line A (implied by sequential data):
- Slopes upward from 2013–2015.
- Dips in 2016.
- Sharp upward slope in 2017.
- Numerical alignment confirms visual trend.
### Component Isolation
- **Regions Processed:**
1. Header (title and column labels).
2. Data rows (2013–2017 with corresponding weights).
3. Trend analysis (logical progression of weights over time).
### Final Output
**Reconstructed Table:**
| Year | Weight (kg) |
|------|-------------|
| 2013 | 27 |
| 2014 | 28 |
| 2015 | 34 |
| 2016 | 29 |
| 2017 | 40 |
**Summary:**
The weight of the winning dog at the dog show fluctuated between 27 kg (2013) and 40 kg (2017), with a notable dip in 2016 followed by a record-breaking increase in 2017.