## Bar Chart: Overall Accuracy Comparison
### Overview
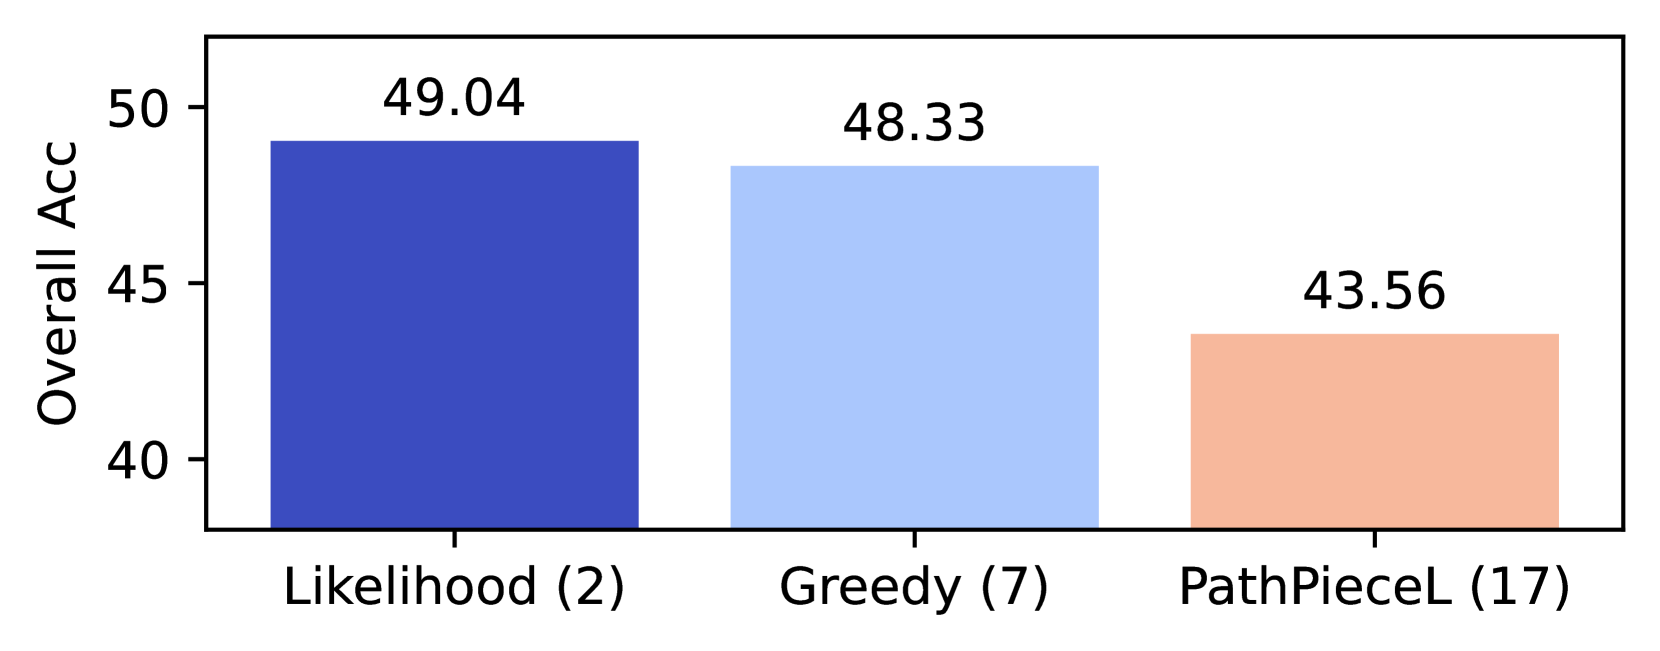
The image is a bar chart comparing the overall accuracy of three different methods: Likelihood, Greedy, and PathPieceL. The y-axis represents "Overall Acc" (Overall Accuracy), and the x-axis represents the three methods. Each method has a corresponding bar, with its height indicating the accuracy value.
### Components/Axes
* **Y-axis:** "Overall Acc" with a scale from 40 to 50, marked at 40, 45, and 50.
* **X-axis:** Categorical axis representing the three methods: Likelihood (2), Greedy (7), and PathPieceL (17). The numbers in parentheses next to each method name are likely counts or identifiers.
* **Bars:** Three bars, each representing a method.
* Likelihood (2): Dark blue bar.
* Greedy (7): Light blue bar.
* PathPieceL (17): Light orange bar.
* **Values:** Numerical values are displayed above each bar, indicating the overall accuracy for each method.
### Detailed Analysis
* **Likelihood (2):** The dark blue bar reaches an accuracy of 49.04.
* **Greedy (7):** The light blue bar reaches an accuracy of 48.33.
* **PathPieceL (17):** The light orange bar reaches an accuracy of 43.56.
### Key Observations
* Likelihood (2) has the highest overall accuracy at 49.04.
* Greedy (7) has the second-highest overall accuracy at 48.33.
* PathPieceL (17) has the lowest overall accuracy at 43.56.
* The difference in accuracy between Likelihood and Greedy is relatively small (approximately 0.71), while the difference between Greedy and PathPieceL is more significant (approximately 4.77).
### Interpretation
The bar chart demonstrates that the Likelihood method achieves the highest overall accuracy compared to the Greedy and PathPieceL methods. The Greedy method performs slightly worse than Likelihood, while the PathPieceL method shows a considerably lower accuracy. The numbers in parentheses next to each method name might represent the number of times each method was used or the number of parameters associated with each method. The data suggests that, based on overall accuracy, Likelihood is the preferred method among the three.