\n
## Bar Chart: Overall Accuracy Comparison
### Overview
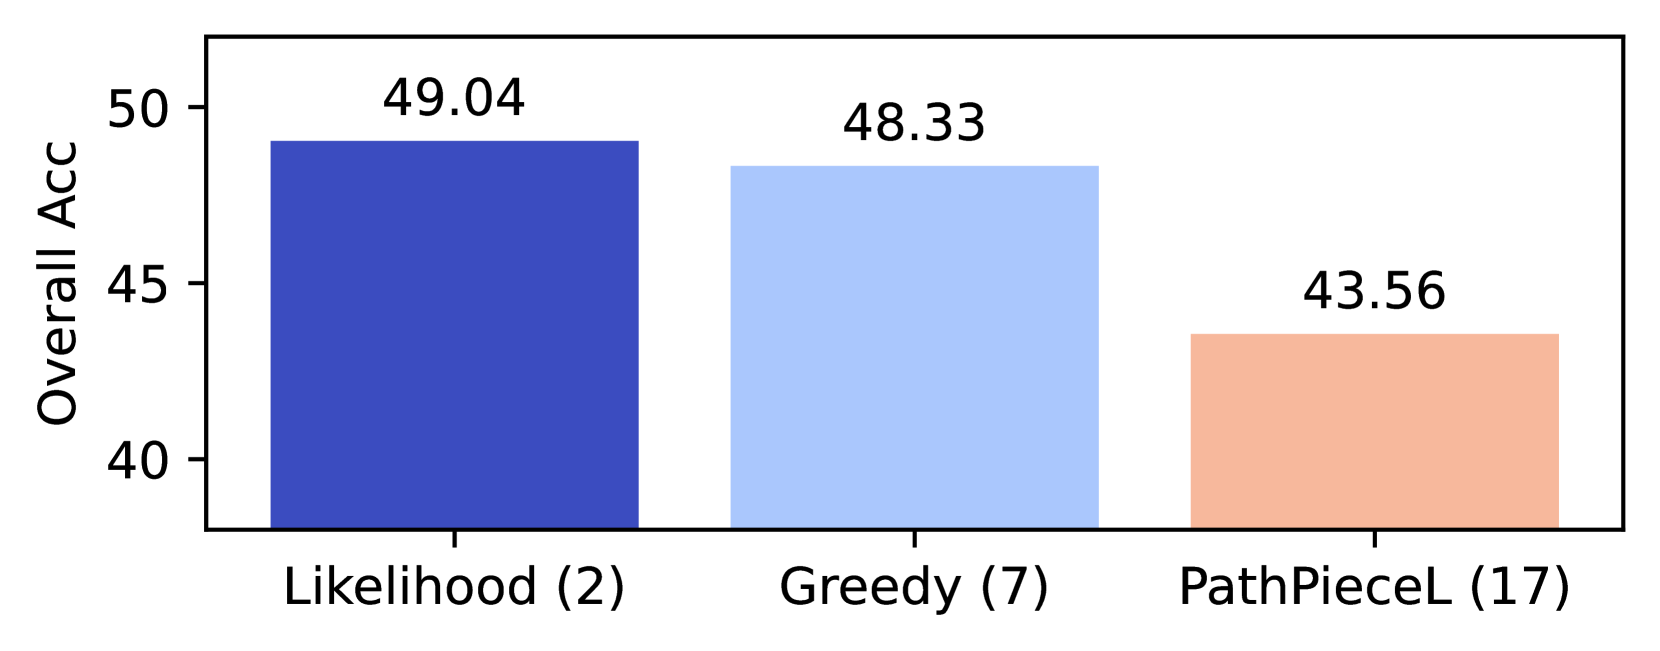
This image presents a bar chart comparing the "Overall ACC" (Accuracy) of three different methods: Likelihood, Greedy, and PathPieceL. The chart uses vertical bars to represent the accuracy scores for each method.
### Components/Axes
* **X-axis:** Represents the methods being compared: "Likelihood (2)", "Greedy (7)", and "PathPieceL (17)". The numbers in parentheses likely represent some identifier or version number for each method.
* **Y-axis:** Labeled "Overall ACC", representing the overall accuracy score. The scale ranges from approximately 35 to 51.
* **Bars:** Three vertical bars, each representing a method. The bars are colored as follows:
* Likelihood: Dark Blue
* Greedy: Light Blue
* PathPieceL: Light Orange/Peach
### Detailed Analysis
* **Likelihood:** The dark blue bar for "Likelihood (2)" reaches a height corresponding to approximately 49.04 on the "Overall ACC" scale.
* **Greedy:** The light blue bar for "Greedy (7)" reaches a height corresponding to approximately 48.33 on the "Overall ACC" scale.
* **PathPieceL:** The light orange/peach bar for "PathPieceL (17)" reaches a height corresponding to approximately 43.56 on the "Overall ACC" scale.
The bars are positioned sequentially along the x-axis, with "Likelihood" on the left, "Greedy" in the center, and "PathPieceL" on the right.
### Key Observations
* "Likelihood" exhibits the highest accuracy score among the three methods.
* "Greedy" has the second-highest accuracy score, slightly lower than "Likelihood".
* "PathPieceL" has the lowest accuracy score, noticeably lower than both "Likelihood" and "Greedy".
* The differences in accuracy between the methods are relatively small, ranging from approximately 43.56 to 49.04.
### Interpretation
The data suggests that the "Likelihood" method performs best in terms of overall accuracy, followed by the "Greedy" method. The "PathPieceL" method demonstrates the lowest accuracy among the three. The relatively small differences in accuracy scores indicate that while "Likelihood" is superior, the other methods are still reasonably competitive. The numbers in parentheses after each method name might indicate the complexity or a version number, potentially suggesting that more complex methods (higher numbers) do not necessarily translate to higher accuracy in this case. The chart provides a direct comparison of the performance of these three methods, allowing for an informed decision about which method to employ based on the desired level of accuracy.