## Bar Chart: Overall Accuracy Comparison of Methods
### Overview
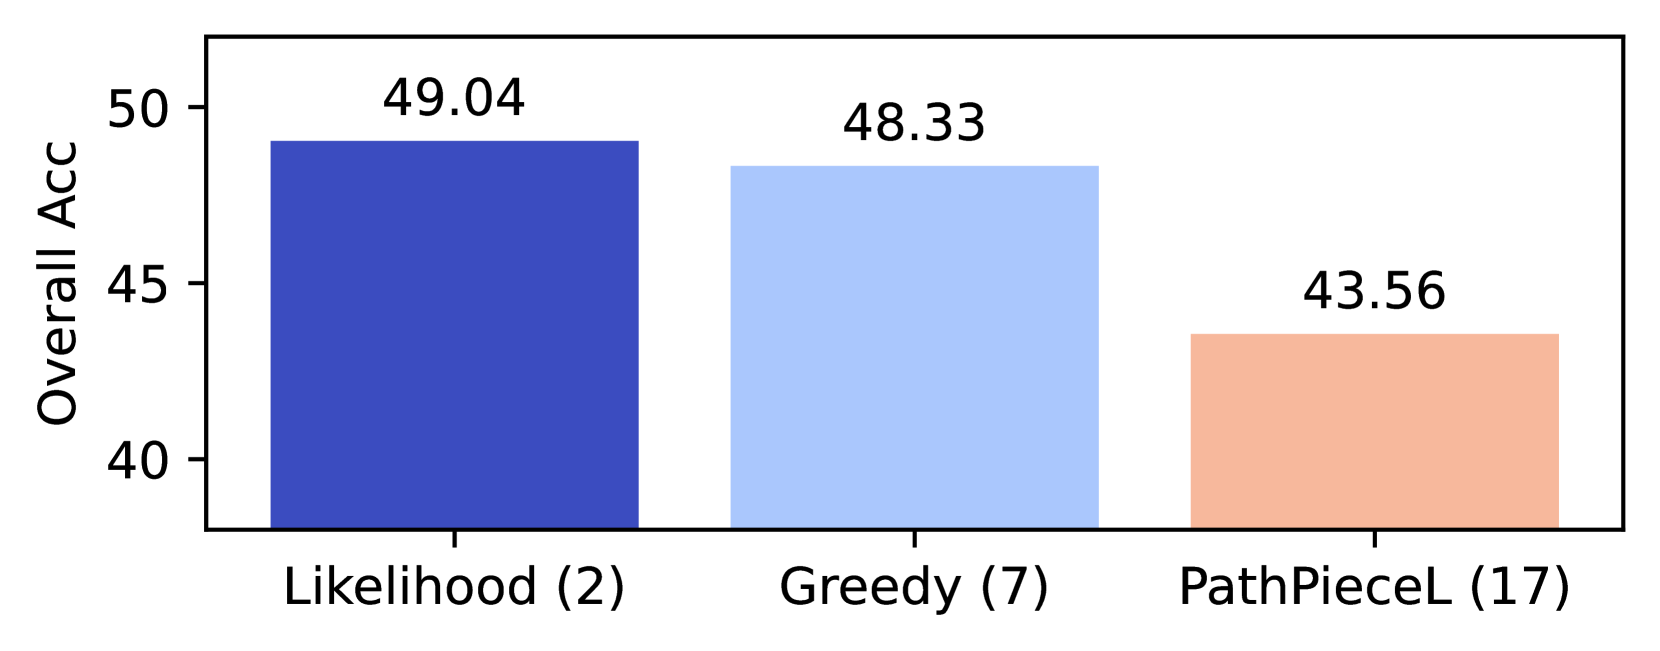
The chart compares the overall accuracy ("Overall Acc") of three methods: **Likelihood (2)**, **Greedy (7)**, and **PathPieceL (17)**. The y-axis ranges from 40 to 50, with three colored bars representing each method's performance.
### Components/Axes
- **Y-Axis**: Labeled "Overall Acc" with a scale from 40 to 50 in increments of 1.
- **X-Axis**: Categories labeled as:
- Likelihood (2)
- Greedy (7)
- PathPieceL (17)
- **Colors**:
- Likelihood: Dark blue
- Greedy: Light blue
- PathPieceL: Peach
### Detailed Analysis
- **Likelihood (2)**:
- Value: 49.04
- Bar height: Highest among the three
- **Greedy (7)**:
- Value: 48.33
- Bar height: Slightly shorter than Likelihood
- **PathPieceL (17)**:
- Value: 43.56
- Bar height: Lowest among the three
### Key Observations
1. **Likelihood (2)** achieves the highest accuracy (49.04) despite having the smallest sample size (2).
2. **Greedy (7)** follows closely with 48.33 accuracy, showing minimal decline from Likelihood.
3. **PathPieceL (17)** has the lowest accuracy (43.56) despite the largest sample size (17).
### Interpretation
The data suggests that **sample size does not directly correlate with accuracy** in this context. While PathPieceL uses 17 samples, its accuracy is significantly lower than the other methods. This could indicate:
- Methodological limitations in PathPieceL's approach.
- Diminishing returns or inefficiencies in larger sample sizes for this task.
- Potential overfitting or noise amplification in PathPieceL with more data.
The slight drop from Likelihood to Greedy (49.04 → 48.33) implies that increasing sample size from 2 to 7 has negligible impact on performance. The stark contrast with PathPieceL highlights the importance of method design over raw data volume in this scenario.