## Line Chart: Premature Output Rate across Similarity Thresholds — All Models
### Overview
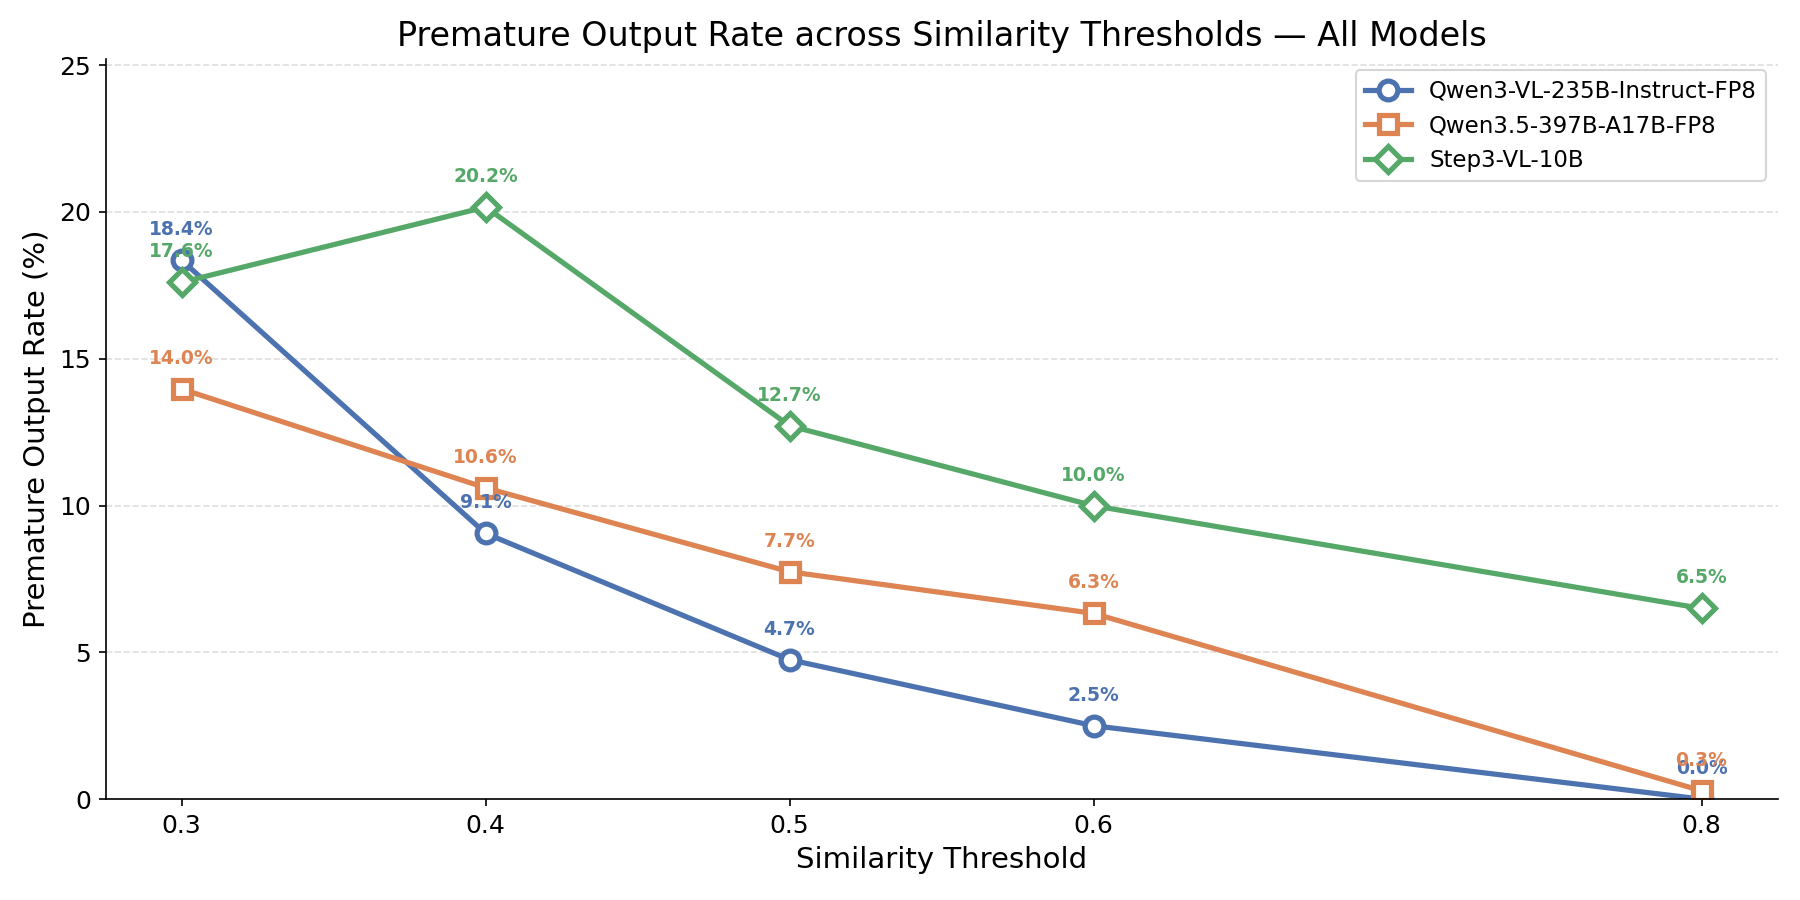
The chart visualizes the relationship between similarity thresholds (x-axis) and premature output rates (y-axis) for three AI models: Qwen3-VL-235B-Instruct-FP8 (blue), Qwen3.5-397B-A17B-FP8 (orange), and Step3-VL-10B (green). Data points are plotted at thresholds of 0.3, 0.4, 0.5, 0.6, and 0.8, with percentages ranging from 0% to 25%.
### Components/Axes
- **X-axis (Similarity Threshold)**: Discrete values at 0.3, 0.4, 0.5, 0.6, and 0.8.
- **Y-axis (Premature Output Rate)**: Continuous scale from 0% to 25%, marked in 5% increments.
- **Legend**: Located in the top-right corner, associating:
- Blue circles with Qwen3-VL-235B-Instruct-FP8
- Orange squares with Qwen3.5-397B-A17B-FP8
- Green diamonds with Step3-VL-10B
### Detailed Analysis
#### Qwen3-VL-235B-Instruct-FP8 (Blue)
- **Trend**: Steeply declining output rate as similarity threshold increases.
- **Values**:
- 0.3: 18.4%
- 0.4: 9.1%
- 0.5: 4.7%
- 0.6: 2.5%
- 0.8: 0.0%
#### Qwen3.5-397B-A17B-FP8 (Orange)
- **Trend**: Gradual decline with a minor uptick at 0.4.
- **Values**:
- 0.3: 14.0%
- 0.4: 10.6%
- 0.5: 7.7%
- 0.6: 6.3%
- 0.8: 0.3%
#### Step3-VL-10B (Green)
- **Trend**: Initial rise to a peak at 0.4, followed by a steady decline.
- **Values**:
- 0.3: 17.6%
- 0.4: 20.2%
- 0.5: 12.7%
- 0.6: 10.0%
- 0.8: 6.5%
### Key Observations
1. **Threshold Impact**: Higher similarity thresholds consistently reduce premature output rates across all models.
2. **Model Performance**:
- **Step3-VL-10B** exhibits the highest initial output rate (17.6% at 0.3) and a peak (20.2% at 0.4), suggesting sensitivity to moderate thresholds.
- **Qwen3-VL-235B-Instruct-FP8** achieves the lowest output rate (0.0% at 0.8), indicating superior threshold tolerance.
- **Qwen3.5-397B-A17B-FP8** shows a gradual decline but retains a residual 0.3% at 0.8.
3. **Anomaly**: Step3-VL-10B’s output rate increases from 0.3 to 0.4, contradicting the general trend of decreasing rates with higher thresholds.
### Interpretation
- **Threshold Optimization**: Higher similarity thresholds (e.g., 0.6–0.8) significantly reduce premature outputs, with Qwen3-VL-235B-Instruct-FP8 performing best at 0.8 (0.0%).
- **Model-Specific Behavior**: Step3-VL-10B’s peak at 0.4 suggests a potential trade-off between threshold stringency and output quality for this model.
- **Robustness**: Qwen3-VL-235B-Instruct-FP8 demonstrates the most consistent performance, eliminating premature outputs entirely at the highest threshold. The orange line’s minor uptick at 0.4 may reflect model-specific quirks or data noise.
This analysis highlights the importance of threshold selection in balancing output quality and efficiency across different AI architectures.