## Chart Type: Line Graphs of Convex Function Cross Sections
### Overview
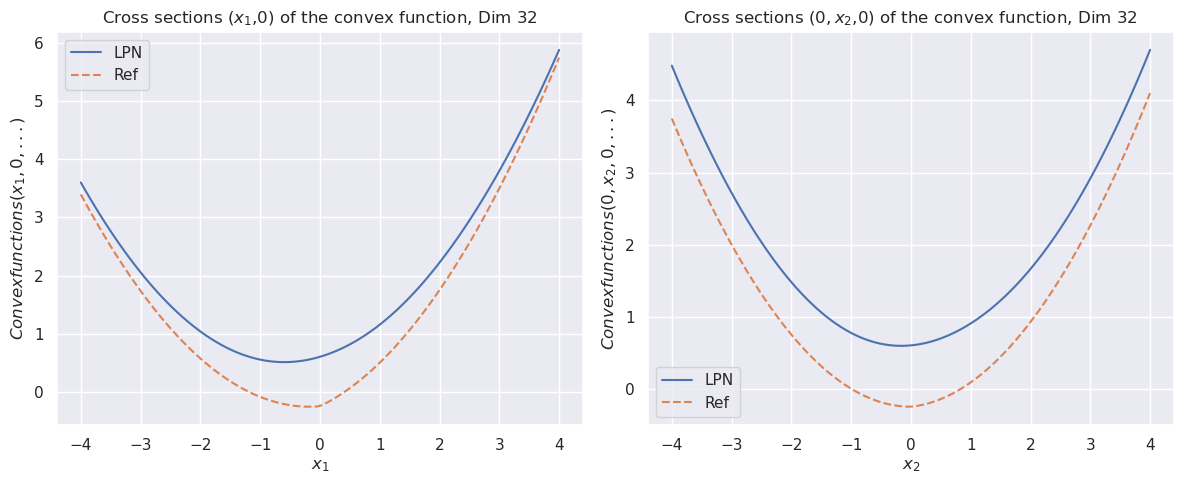
The image presents two line graphs, each displaying cross-sections of a convex function with dimension 32. The left graph shows the cross-section (x1, 0), while the right graph shows (0, x2, 0). Each graph plots two data series: "LPN" (solid blue line) and "Ref" (dashed orange line). The x-axis represents x1 in the left graph and x2 in the right graph, ranging from -4 to 4. The y-axis represents the value of the convex function.
### Components/Axes
**Left Graph:**
* **Title:** Cross sections (x1,0) of the convex function, Dim 32
* **X-axis:** x1, ranging from -4 to 4 in increments of 1.
* **Y-axis:** Convexfunctions(x1, 0, ...), ranging from 0 to 6 in increments of 1.
* **Legend:** Located in the top-left corner.
* LPN: Solid blue line
* Ref: Dashed orange line
**Right Graph:**
* **Title:** Cross sections (0, x2,0) of the convex function, Dim 32
* **X-axis:** x2, ranging from -4 to 4 in increments of 1.
* **Y-axis:** Convexfunctions(0, x2, 0, ...), ranging from 0 to 4 in increments of 1.
* **Legend:** Located in the bottom-left corner.
* LPN: Solid blue line
* Ref: Dashed orange line
### Detailed Analysis
**Left Graph (x1, 0):**
* **LPN (Solid Blue):** The line forms a U-shape. It decreases from approximately 3.5 at x1 = -4 to a minimum of approximately 0.5 at x1 = 0, then increases to approximately 5.8 at x1 = 4.
* x1 = -4, y ≈ 3.5
* x1 = -2, y ≈ 1
* x1 = 0, y ≈ 0.5
* x1 = 2, y ≈ 1
* x1 = 4, y ≈ 5.8
* **Ref (Dashed Orange):** The line also forms a U-shape, but with a lower minimum value. It decreases from approximately 3.3 at x1 = -4 to a minimum of approximately -0.3 at x1 = 0, then increases to approximately 5.5 at x1 = 4.
* x1 = -4, y ≈ 3.3
* x1 = -2, y ≈ 0.3
* x1 = 0, y ≈ -0.3
* x1 = 2, y ≈ 0.3
* x1 = 4, y ≈ 5.5
**Right Graph (0, x2, 0):**
* **LPN (Solid Blue):** The line forms a U-shape. It decreases from approximately 4.5 at x2 = -4 to a minimum of approximately 0.5 at x2 = 0, then increases to approximately 5.8 at x2 = 4.
* x2 = -4, y ≈ 4.5
* x2 = -2, y ≈ 1
* x2 = 0, y ≈ 0.5
* x2 = 2, y ≈ 1
* x2 = 4, y ≈ 5.8
* **Ref (Dashed Orange):** The line also forms a U-shape, but with a lower minimum value. It decreases from approximately 3.5 at x2 = -4 to a minimum of approximately -0.3 at x2 = 0, then increases to approximately 4 at x2 = 4.
* x2 = -4, y ≈ 3.5
* x2 = -2, y ≈ 0.3
* x2 = 0, y ≈ -0.3
* x2 = 2, y ≈ 0.3
* x2 = 4, y ≈ 4
### Key Observations
* Both graphs show a convex (U-shaped) function.
* The "LPN" and "Ref" lines follow similar trends in both graphs, but the "Ref" line has a lower minimum value.
* The left graph (x1, 0) has a slightly higher y-axis range than the right graph (0, x2, 0).
* The minimum value for both LPN curves is approximately 0.5, occurring at x1 = 0 and x2 = 0.
* The minimum value for both Ref curves is approximately -0.3, occurring at x1 = 0 and x2 = 0.
### Interpretation
The graphs compare the cross-sections of a convex function as represented by two different methods, "LPN" and "Ref." The "Ref" method consistently yields lower values than the "LPN" method, especially near the minimum of the function. This suggests that "Ref" might be a more aggressive approximation or optimization technique, potentially leading to lower function values but also possibly introducing some bias or instability. The fact that both cross-sections (x1, 0) and (0, x2, 0) exhibit similar behavior indicates that the function is likely symmetric with respect to the x1 and x2 axes around the origin. The dimension of the convex function is 32, which implies that these are just two slices of a much higher-dimensional space.