## Chart: Cross Sections of Convex Function (Dim 32)
### Overview
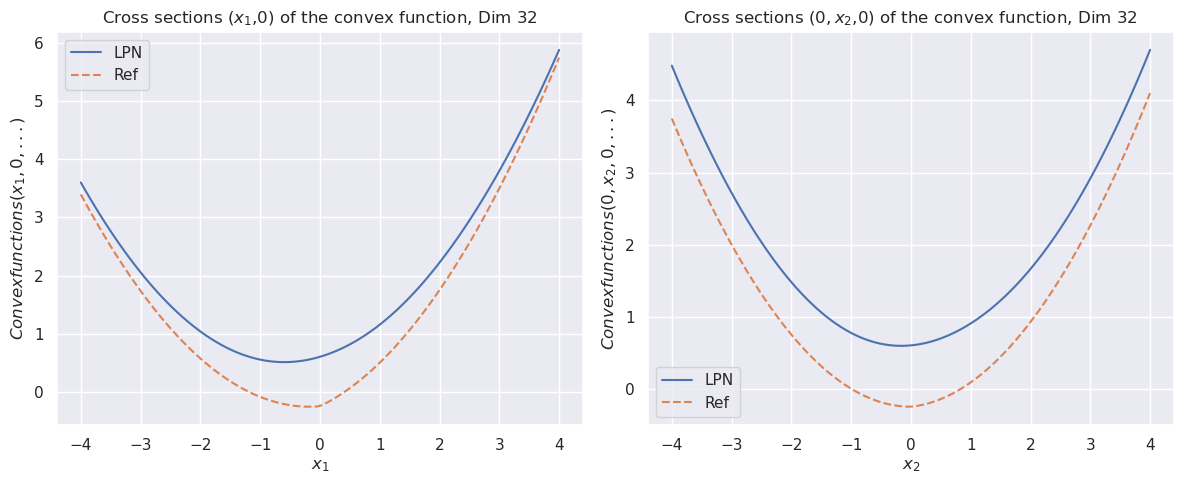
The image presents two charts, side-by-side, both depicting cross-sections of a convex function in a 32-dimensional space. Each chart shows the function's value along a single axis (x1 and x2 respectively) while all other dimensions are held constant at 0. Two curves are plotted on each chart, representing different methods ("LPN" and "Ref"). The y-axis is labeled "Convexfunctions(x1, 0, ...)" and "Convexfunctions(0, x2, 0, ...)" for the left and right charts, respectively.
### Components/Axes
* **Title:** "Cross sections (x1,0) of the convex function, Dim 32" (Left Chart) and "Cross sections (0,x2,0) of the convex function, Dim 32" (Right Chart)
* **X-axis:** Labeled "x1" (Left Chart) and "x2" (Right Chart). Scale ranges from approximately -4 to 4.
* **Y-axis:** Labeled "Convexfunctions(x1, 0, ...)" (Left Chart) and "Convexfunctions(0, x2, 0, ...)" (Right Chart). Scale ranges from approximately 0 to 6.
* **Legend:** Located in the top-left corner of each chart.
* "LPN" - Solid blue line.
* "Ref" - Dashed orange line.
* **Grid:** A light gray grid is present on both charts.
### Detailed Analysis or Content Details
**Left Chart (x1 axis):**
* **LPN (Blue Line):** The curve is a parabola opening upwards. It reaches a minimum value of approximately 0 at x1 = 0. The curve rises symmetrically on both sides of x1 = 0.
* At x1 = -4, the value is approximately 5.5.
* At x1 = -2, the value is approximately 2.5.
* At x1 = -1, the value is approximately 1.5.
* At x1 = 1, the value is approximately 1.5.
* At x1 = 2, the value is approximately 2.5.
* At x1 = 4, the value is approximately 5.5.
* **Ref (Orange Dashed Line):** The curve is also a parabola opening upwards, but it is wider and flatter than the LPN curve. It reaches a minimum value of approximately 0 at x1 = 0.
* At x1 = -4, the value is approximately 4.
* At x1 = -2, the value is approximately 1.5.
* At x1 = -1, the value is approximately 0.75.
* At x1 = 1, the value is approximately 0.75.
* At x1 = 2, the value is approximately 1.5.
* At x1 = 4, the value is approximately 4.
**Right Chart (x2 axis):**
* **LPN (Blue Line):** The curve is a parabola opening upwards. It reaches a minimum value of approximately 0 at x2 = 0. The curve rises symmetrically on both sides of x2 = 0.
* At x2 = -4, the value is approximately 5.5.
* At x2 = -2, the value is approximately 2.5.
* At x2 = -1, the value is approximately 1.5.
* At x2 = 1, the value is approximately 1.5.
* At x2 = 2, the value is approximately 2.5.
* At x2 = 4, the value is approximately 5.5.
* **Ref (Orange Dashed Line):** The curve is also a parabola opening upwards, but it is wider and flatter than the LPN curve. It reaches a minimum value of approximately 0 at x2 = 0.
* At x2 = -4, the value is approximately 4.
* At x2 = -2, the value is approximately 1.5.
* At x2 = -1, the value is approximately 0.75.
* At x2 = 1, the value is approximately 0.75.
* At x2 = 2, the value is approximately 1.5.
* At x2 = 4, the value is approximately 4.
### Key Observations
* Both charts exhibit similar parabolic shapes for both the LPN and Ref curves.
* The LPN curve is consistently steeper and has a lower minimum value than the Ref curve in both charts.
* The Ref curve is wider and flatter, indicating a less sensitive response to changes in x1 and x2.
* The minimum value of both curves is 0, occurring at x1 = 0 and x2 = 0 respectively.
* The curves are symmetrical around the y-axis in both charts.
### Interpretation
The charts demonstrate the behavior of a convex function in two dimensions (x1 and x2) while holding all other dimensions constant in a 32-dimensional space. The two curves, "LPN" and "Ref," likely represent different methods or algorithms for approximating or evaluating the convex function.
The steeper LPN curve suggests that this method is more sensitive to changes in x1 and x2, resulting in a more pronounced curvature and a lower minimum value. This could indicate a more accurate or efficient approximation. The flatter Ref curve suggests a more robust but potentially less accurate or efficient method.
The symmetry of the curves around the y-axis indicates that the convex function is symmetric with respect to the x1 and x2 axes. This symmetry might be a property of the function itself or a result of the specific cross-sections being examined.
The fact that both curves reach a minimum value of 0 suggests that the function has a global minimum at the origin (x1 = 0, x2 = 0) in this specific cross-section. The differences in the curves' shapes and values suggest that the LPN and Ref methods may converge to this minimum at different rates or with different levels of accuracy.