## Line Charts: Cross Sections of a Convex Function (Dim 32)
### Overview
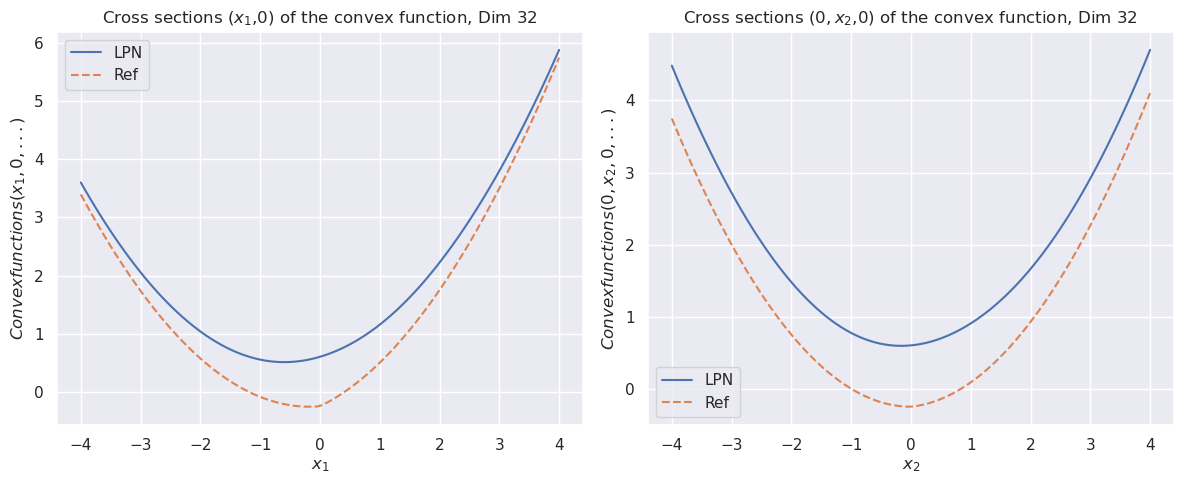
The image contains two side-by-side line charts. Both plots display cross-sectional views of a convex function in a 32-dimensional space. Each chart compares two functions: "LPN" (solid blue line) and "Ref" (dashed orange line). The plots are visually similar, showing U-shaped (convex) curves, but they represent different cross-sections of the high-dimensional function.
### Components/Axes
**Left Chart:**
* **Title:** `Cross sections (x₁,0) of the convex function, Dim 32`
* **Y-axis Label:** `Convexfunctions(x₁, 0, ... )`
* **X-axis Label:** `x₁`
* **X-axis Range:** -4 to 4
* **Y-axis Range:** Approximately -0.5 to 6
* **Legend:** Located in the top-left corner.
* `LPN`: Solid blue line.
* `Ref`: Dashed orange line.
**Right Chart:**
* **Title:** `Cross sections (0, x₂,0) of the convex function, Dim 32`
* **Y-axis Label:** `Convexfunctions(0, x₂, 0, ... )`
* **X-axis Label:** `x₂`
* **X-axis Range:** -4 to 4
* **Y-axis Range:** Approximately -0.5 to 4.5
* **Legend:** Located in the bottom-left corner.
* `LPN`: Solid blue line.
* `Ref`: Dashed orange line.
### Detailed Analysis
**Left Chart (Cross-section along x₁):**
* **Trend Verification:** Both curves are symmetric, U-shaped parabolas with minima near x₁ = 0.
* **LPN (Blue, Solid):** The curve is always above the Ref curve. Its minimum value at x₁=0 is approximately **0.5**. At the extremes (x₁ = ±4), the value is approximately **5.8**.
* **Ref (Orange, Dashed):** The curve dips below zero. Its minimum value at x₁=0 is approximately **-0.3**. At the extremes (x₁ = ±4), the value is approximately **5.6**.
**Right Chart (Cross-section along x₂):**
* **Trend Verification:** Both curves are again symmetric, U-shaped parabolas with minima near x₂ = 0.
* **LPN (Blue, Solid):** The curve is always above the Ref curve. Its minimum value at x₂=0 is approximately **0.6**. At the extremes (x₂ = ±4), the value is approximately **4.5**.
* **Ref (Orange, Dashed):** The curve dips below zero. Its minimum value at x₂=0 is approximately **-0.3**. At the extremes (x₂ = ±4), the value is approximately **4.1**.
### Key Observations
1. **Consistent Hierarchy:** In both cross-sections, the LPN function is strictly greater than the Ref function for all plotted values of x₁ and x₂.
2. **Minima Location:** The minimum of both functions occurs at the origin (x=0) in their respective cross-sections.
3. **Negative Values:** The Ref function takes on negative values near its minimum in both plots, while the LPN function remains positive.
4. **Similar Shape, Different Scale:** The shapes of the curves are nearly identical, but the vertical offset between LPN and Ref is consistent. The overall scale (y-axis range) is slightly larger for the x₁ cross-section.
### Interpretation
The data demonstrates that the "LPN" function is a convex approximation or variant of the "Ref" (Reference) function. The key finding is that LPN is a **shifted or regularized version** of Ref, as it maintains the same convex shape but is vertically offset upwards, eliminating the negative values present in the reference.
This suggests LPN might be designed to enforce a **non-negativity constraint** or to have a **higher minimum value** than the original function. The symmetry around zero in both cross-sections indicates the underlying high-dimensional function is likely even (symmetric) with respect to its input dimensions. The comparison across two different cross-sections (x₁ and x₂) shows this offset behavior is consistent across different dimensions of the function's input space.