## Line Graphs: Cross Sections of Convex Function in 32D Space
### Overview
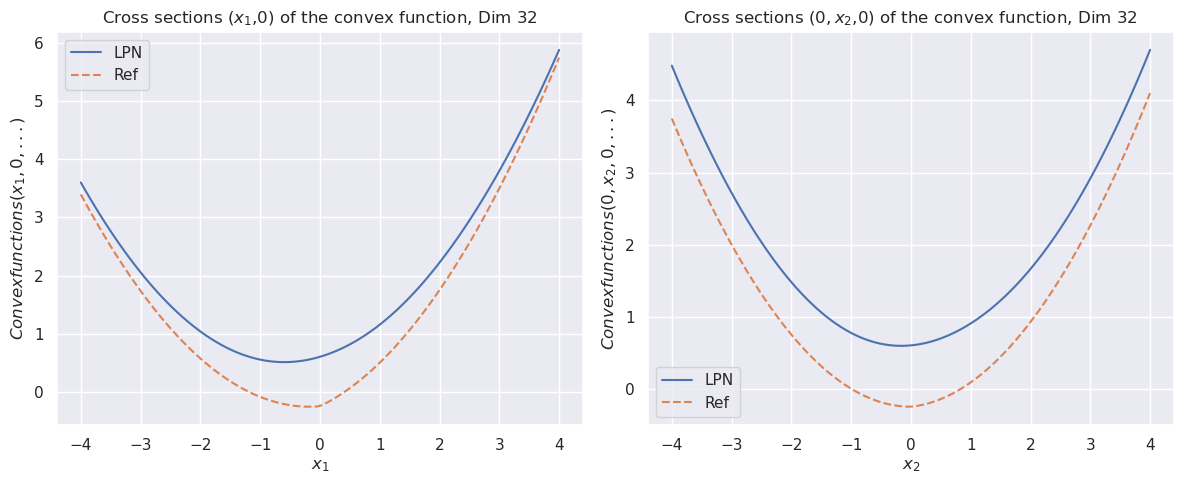
The image contains two side-by-side line graphs comparing two convex functions ("LPN" and "Ref") across two orthogonal cross-sections of a 32-dimensional space. Both graphs show U-shaped curves with distinct minima and maxima, suggesting optimization or constraint-related behavior.
### Components/Axes
**Left Graph (x₁,0 cross-section):**
- **X-axis**: x₁ (range: -4 to 4, increments of 1)
- **Y-axis**: Convex functions (range: 0 to 6, increments of 1)
- **Legend**:
- Solid blue line: LPN
- Dashed orange line: Ref
- **Title**: "Cross sections (x₁,0) of the convex function, Dim 32"
**Right Graph (0,x₂,0 cross-section):**
- **X-axis**: x₂ (range: -4 to 4, increments of 1)
- **Y-axis**: Convex functions (range: 0 to 6, increments of 1)
- **Legend**:
- Solid blue line: LPN
- Dashed orange line: Ref
- **Title**: "Cross sections (0,x₂,0) of the convex function, Dim 32"
### Detailed Analysis
**Left Graph (x₁,0):**
- **LPN (blue)**:
- Starts at ~3.5 when x₁ = -4
- Decreases to minimum ~0.5 at x₁ = 0
- Increases to ~5.5 at x₁ = 4
- **Ref (orange)**:
- Starts at ~3.2 when x₁ = -4
- Decreases to minimum ~0.0 at x₁ = 0
- Increases to ~4.8 at x₁ = 4
**Right Graph (0,x₂,0):**
- **LPN (blue)**:
- Starts at ~4.5 when x₂ = -4
- Decreases to minimum ~0.8 at x₂ = 0
- Increases to ~5.8 at x₂ = 4
- **Ref (orange)**:
- Starts at ~3.8 when x₂ = -4
- Decreases to minimum ~0.2 at x₂ = 0
- Increases to ~4.2 at x₂ = 4
### Key Observations
1. **Symmetry**: Both graphs exhibit mirror-symmetric U-shaped curves, confirming convexity.
2. **LPN vs. Ref**:
- LPN consistently shows higher values than Ref at equivalent x-values
- LPN's minimum is ~0.5 (x₁) and ~0.8 (x₂), while Ref reaches 0.0 (x₁) and 0.2 (x₂)
3. **Dimensional Consistency**: Similar curvature patterns in both cross-sections suggest isotropic properties in the 32D space.
4. **Asymmetry in Peaks**: LPN's right-side peak is steeper than its left-side peak in both graphs.
### Interpretation
The data demonstrates two convex functions with distinct optimization landscapes:
1. **LPN Function**:
- Represents a "harder" constraint surface with higher minimum values
- Shows greater sensitivity to input variations (steeper slopes)
- May model stricter optimization criteria or penalty terms
2. **Ref Function**:
- Represents a "softer" baseline with lower minimum values
- Could represent an idealized or theoretical benchmark
- The near-zero minimum in x₁ suggests potential degeneracy in certain dimensions
The consistent LPN dominance across both cross-sections implies that the 32D function maintains its convex properties while exhibiting dimensional coupling - changes in one dimension (x₁) correlate with proportional changes in orthogonal dimensions (x₂). The minimum value discrepancies suggest potential phase transitions or critical points in the function's behavior.