## Chart Type: Multiple Time Series Plots
### Overview
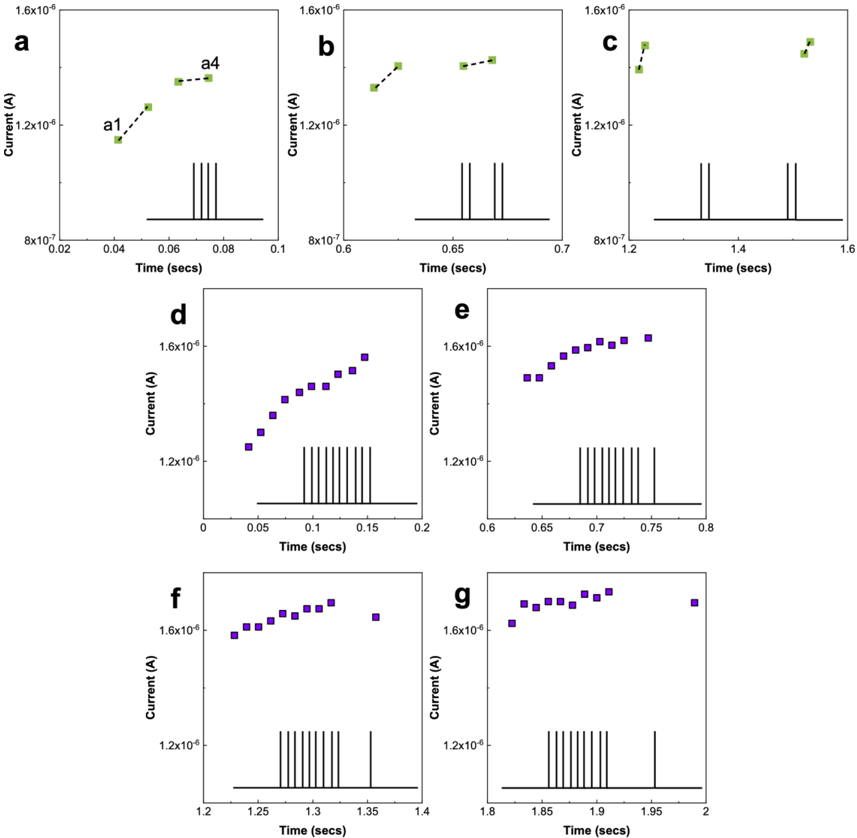
The image contains seven time series plots (labeled a-g), each showing the relationship between current (in Amperes) and time (in seconds). Each plot also includes a schematic representation of a stimulus pattern along the time axis. The current values are on the order of 10^-6 Amperes.
### Components/Axes
* **Y-axis (Current):** All plots share the same y-axis, labeled "Current (A)". The scale ranges from approximately 8x10^-7 to 1.6x10^-6.
* **X-axis (Time):** All plots have an x-axis labeled "Time (secs)". The time scales vary between plots.
* **Data Points:** Data points are represented by squares. Plots a, b, and c use green squares, while plots d, e, f, and g use purple squares.
* **Stimulus Pattern:** Each plot includes a schematic representation of a stimulus pattern, depicted as vertical lines along the x-axis.
* **Labels:** Plot 'a' has labels 'a1' and 'a4' indicating specific data points.
### Detailed Analysis
**Plot a:**
* **X-axis:** Time ranges from approximately 0.02 to 0.1 seconds.
* **Data Points:** Green squares.
* **Trend:** The current increases with time.
* **Values:**
* a1: Time ~ 0.04 secs, Current ~ 1.2x10^-6 A
* a4: Time ~ 0.07 secs, Current ~ 1.4x10^-6 A
* **Stimulus Pattern:** Four vertical lines, indicating four stimuli.
**Plot b:**
* **X-axis:** Time ranges from approximately 0.6 to 0.7 seconds.
* **Data Points:** Green squares.
* **Trend:** The current increases slightly with time.
* **Values:**
* Time ~ 0.61 secs, Current ~ 1.3x10^-6 A
* Time ~ 0.67 secs, Current ~ 1.4x10^-6 A
* **Stimulus Pattern:** Two vertical lines, indicating two stimuli.
**Plot c:**
* **X-axis:** Time ranges from approximately 1.2 to 1.6 seconds.
* **Data Points:** Green squares.
* **Trend:** The current increases slightly with time.
* **Values:**
* Time ~ 1.2 secs, Current ~ 1.4x10^-6 A
* Time ~ 1.4 secs, Current ~ 1.5x10^-6 A
* **Stimulus Pattern:** Two vertical lines, indicating two stimuli.
**Plot d:**
* **X-axis:** Time ranges from approximately 0 to 0.2 seconds.
* **Data Points:** Purple squares.
* **Trend:** The current increases with time.
* **Values:**
* Time ~ 0.02 secs, Current ~ 1.2x10^-6 A
* Time ~ 0.16 secs, Current ~ 1.6x10^-6 A
* **Stimulus Pattern:** Eight vertical lines, indicating eight stimuli.
**Plot e:**
* **X-axis:** Time ranges from approximately 0.6 to 0.8 seconds.
* **Data Points:** Purple squares.
* **Trend:** The current increases with time.
* **Values:**
* Time ~ 0.61 secs, Current ~ 1.4x10^-6 A
* Time ~ 0.75 secs, Current ~ 1.6x10^-6 A
* **Stimulus Pattern:** Eight vertical lines, indicating eight stimuli.
**Plot f:**
* **X-axis:** Time ranges from approximately 1.2 to 1.4 seconds.
* **Data Points:** Purple squares.
* **Trend:** The current increases with time.
* **Values:**
* Time ~ 1.22 secs, Current ~ 1.4x10^-6 A
* Time ~ 1.35 secs, Current ~ 1.6x10^-6 A
* **Stimulus Pattern:** Eight vertical lines, indicating eight stimuli.
**Plot g:**
* **X-axis:** Time ranges from approximately 1.8 to 2.0 seconds.
* **Data Points:** Purple squares.
* **Trend:** The current increases with time.
* **Values:**
* Time ~ 1.81 secs, Current ~ 1.5x10^-6 A
* Time ~ 1.98 secs, Current ~ 1.7x10^-6 A
* **Stimulus Pattern:** Eight vertical lines, indicating eight stimuli.
### Key Observations
* The current generally increases with time in all plots.
* The stimulus patterns vary in the number of stimuli and their timing.
* Plots a, b, and c show a smaller number of stimuli and a shorter time scale compared to plots d, e, f, and g.
* Plots a, b, and c use green data points, while plots d, e, f, and g use purple data points.
### Interpretation
The plots likely represent the response of a system (possibly a biological or electronic system) to different stimulus patterns. The increase in current over time suggests that the system is responding to the stimuli. The different stimulus patterns and data point colors (green vs. purple) may represent different experimental conditions or different types of stimuli. The data suggests that the system's response is dependent on the timing and number of stimuli applied. Further information about the experimental setup and the nature of the stimuli would be needed to fully interpret the results.