## Line Graph: Percentage of Charging Plugs Over Time
### Overview
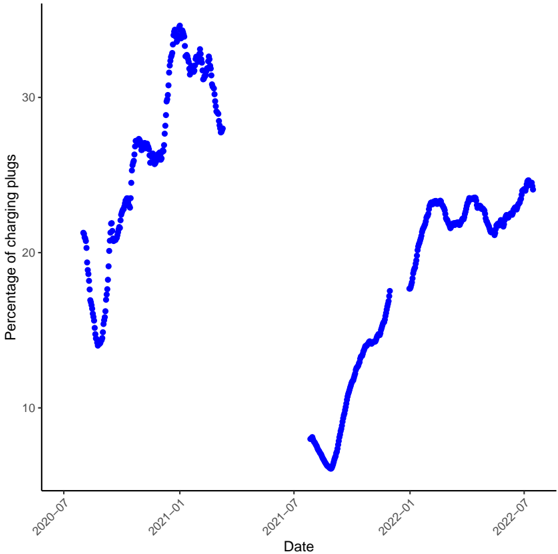
The image depicts a line graph illustrating the percentage of charging plugs over a three-year period (2020-07 to 2022-07). The graph shows two distinct trends: an initial sharp increase followed by a decline, and a subsequent gradual recovery.
### Components/Axes
- **X-axis (Horizontal)**: Labeled "Date," with markers at 2020-07, 2021-01, 2021-07, 2022-01, and 2022-07. The scale spans 2.5 years.
- **Y-axis (Vertical)**: Labeled "Percentage of charging plugs," with increments of 10% (0–30%).
- **Legend**: Absent. The data series is represented by a single blue dotted line.
- **Data Series**: A single blue dotted line with plotted points connected sequentially.
### Detailed Analysis
- **Initial Trend (2020-07 to 2021-01)**:
- Starts at ~20% in July 2020.
- Rises sharply to ~30% by January 2021.
- Peaks at ~32% in early 2021 (exact date unclear).
- Drops abruptly to ~10% by mid-2021 (July 2021).
- **Recovery Phase (2021-07 to 2022-07)**:
- Begins at ~10% in July 2021.
- Gradually increases to ~25% by July 2022.
- Exhibits minor fluctuations (e.g., ~22% in early 2022, ~24% in mid-2022).
### Key Observations
1. **Sharp Initial Growth**: A rapid 10% increase from July 2020 to January 2021, followed by an equally steep decline to 10% by mid-2021.
2. **Prolonged Recovery**: A steady 15% increase over 18 months (July 2021–July 2022), with no sharp drops.
3. **Volatility**: The graph shows high volatility in the first year, stabilizing in the second half.
### Interpretation
The data suggests a cyclical pattern in charging plug adoption. The initial surge (2020–2021) could reflect policy incentives, infrastructure expansion, or market demand spikes. The subsequent drop may indicate supply chain disruptions, regulatory changes, or reduced consumer interest. The recovery phase implies renewed investment or stabilization of the market. The absence of a legend limits clarity on data sources or categories, but the trend aligns with typical adoption-curve dynamics (e.g., early adopters followed by market saturation and recovery). The 2021–2022 recovery suggests long-term growth potential despite short-term fluctuations.