## Chart: Percentage of Charging Plugs Over Time
### Overview
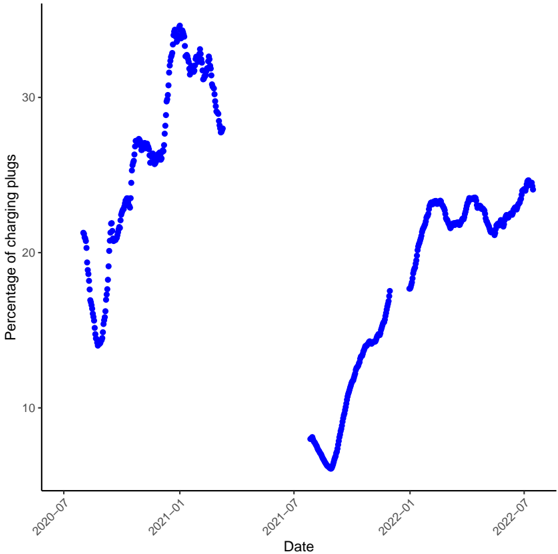
The image is a scatter plot showing the percentage of charging plugs over time. The x-axis represents the date, ranging from approximately July 2020 to July 2022. The y-axis represents the percentage of charging plugs, ranging from 10% to 30%. The data points are connected by a blue line, showing the trend of charging plug usage over the specified period. There appears to be a gap in the data between approximately January 2021 and July 2021.
### Components/Axes
* **X-axis:** Date, with markers at 2020-07, 2021-01, 2021-07, 2022-01, and 2022-07.
* **Y-axis:** Percentage of charging plugs, with markers at 10, 20, and 30.
* **Data Series:** A single data series represented by a blue line.
### Detailed Analysis
* **2020-07 to 2021-01:** The percentage of charging plugs initially decreases from approximately 22% to 14% between July 2020 and September 2020, then increases sharply to a peak of approximately 34% around January 2021.
* **2021-01 to 2021-07:** There is a gap in the data during this period.
* **2021-07 to 2022-01:** The percentage of charging plugs starts at a low of approximately 6% in July 2021 and increases steadily to approximately 18% by January 2022.
* **2022-01 to 2022-07:** The percentage of charging plugs fluctuates between approximately 22% and 24% from January 2022 to July 2022.
### Key Observations
* There is a significant gap in the data between January 2021 and July 2021.
* The percentage of charging plugs shows a general upward trend from July 2021 to July 2022.
* The highest percentage of charging plugs is observed around January 2021.
* The lowest percentage of charging plugs is observed around July 2021.
### Interpretation
The data suggests that the usage of charging plugs experienced a period of high activity around January 2021, followed by a decline and subsequent recovery. The gap in the data makes it difficult to fully understand the trend during that period. The upward trend from July 2021 to July 2022 indicates a growing adoption or usage of electric vehicles or charging infrastructure. The fluctuations in 2022 could be due to seasonal variations or other factors affecting charging behavior.