## Circular Diagram: PRM Workflow
### Overview
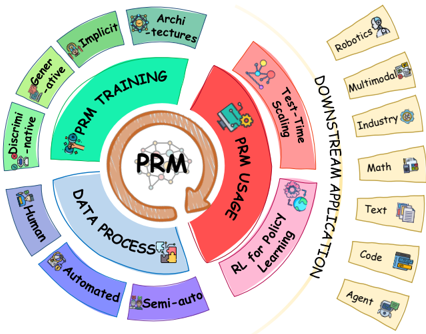
The image is a circular diagram illustrating the workflow of a PRM (likely referring to a Probabilistic Roadmap) system. It depicts the process from data processing and training to usage and downstream applications. The diagram is divided into four main sections arranged in a circular fashion: Data Process, PRM Training, PRM Usage, and Downstream Application. An arrow indicates the flow of the process.
### Components/Axes
* **Central Element:** "PRM" is at the center of the diagram.
* **Sections:**
* **Data Process (Blue):** Located at the bottom-left. Sub-categories include:
* Human
* Automated
* Semi-auto
* **PRM Training (Green):** Located at the top-left. Sub-categories include:
* Discriminative
* Generative
* Implicit
* Architectures
* **PRM Usage (Red):** Located at the top-right. Sub-categories include:
* Test-Time Scaling
* RL for Policy Learning
* **Downstream Application (Tan):** Located at the bottom-right. Sub-categories include:
* Robotics
* Multimodal
* Industry
* Math
* Text
* Code
* Agent
* **Flow:** A brown arrow indicates the flow from Data Process to PRM Training to PRM Usage, and finally to Downstream Application.
### Detailed Analysis
* **Data Process:** This section focuses on how the data is prepared for the PRM system. The sub-categories "Human," "Automated," and "Semi-auto" suggest different levels of human involvement in the data processing stage.
* **PRM Training:** This section describes the training phase of the PRM. The sub-categories "Discriminative," "Generative," "Implicit," and "Architectures" likely refer to different training methodologies or architectural choices for the PRM model.
* **PRM Usage:** This section focuses on how the trained PRM is utilized. The sub-categories "Test-Time Scaling" and "RL for Policy Learning" suggest different applications of the PRM, such as scaling during testing and using it for reinforcement learning.
* **Downstream Application:** This section describes the various applications of the PRM system. The sub-categories "Robotics," "Multimodal," "Industry," "Math," "Text," "Code," and "Agent" indicate a wide range of potential uses for the PRM.
### Key Observations
* The diagram emphasizes the cyclical nature of the PRM workflow, with the output of one stage feeding into the next.
* The sub-categories within each section provide a more detailed breakdown of the different aspects of the PRM system.
* The diagram highlights the versatility of PRMs, with applications ranging from robotics to text processing.
### Interpretation
The diagram provides a high-level overview of the PRM workflow, from data preparation to downstream applications. It suggests that PRMs are a versatile tool that can be used in a variety of domains. The diagram also emphasizes the importance of data processing and training in the overall performance of the PRM system. The cyclical nature of the diagram suggests that the PRM workflow is an iterative process, with feedback loops between different stages. The diagram is designed to illustrate the different stages and applications of a PRM system, highlighting its flexibility and potential impact across various fields.