\n
## Diagram: PRM Framework Overview
### Overview
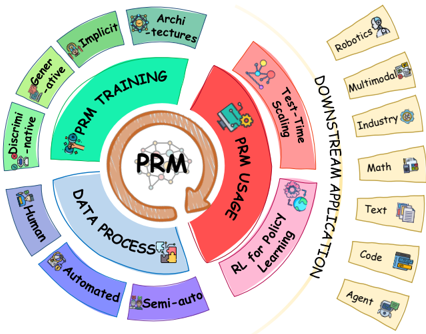
The image depicts a circular diagram illustrating a framework centered around "PRM" (likely Policy Reinforcement Learning or a similar concept). The diagram is structured as concentric rings, representing different stages or aspects of the framework: Data Process, PRM Training, PRM Usage, and Downstream Application. Each segment within these rings is labeled with specific techniques, data sources, or application areas. The diagram uses icons alongside text labels to visually represent each element.
### Components/Axes
The diagram consists of four main concentric rings:
1. **Inner Circle:** Contains the text "PRM" with a gear icon.
2. **Data Process Ring (Purple):** Labeled with "DATA PROCESS" and includes segments for "Human", "Automated", and "Semi-auto".
3. **PRM Training Ring (Green):** Labeled with "PRM TRAINING" and includes segments for "Discriminative", "Generative", "Implicit", and "Architectures".
4. **PRM Usage Ring (Red):** Labeled with "PRM USAGE" and includes segments for "Test-Time Scaling", and "RL for Policy Learning".
5. **Downstream Application Ring (Yellow):** Labeled with "DOWNSTREAM APPLICATION" and includes segments for "Robotics", "Multimodal", "Industry", "Math", "Text", "Code", and "Agent".
Arrows indicate a flow from the Data Process ring, through PRM Training and PRM Usage, towards Downstream Application. Each segment also has a corresponding icon.
### Detailed Analysis / Content Details
Here's a breakdown of each segment with its associated icon:
* **PRM (Center):** Gear icon.
* **Data Process:**
* **Human:** Icon of a person.
* **Automated:** Icon of a robot.
* **Semi-auto:** Icon of a hand interacting with a robotic arm.
* **PRM Training:**
* **Discriminative:** Icon of a magnifying glass.
* **Generative:** Icon of a lightbulb.
* **Implicit:** Icon of a brain.
* **Architectures:** Icon of building blocks.
* **PRM Usage:**
* **Test-Time Scaling:** Icon of a scale.
* **RL for Policy Learning:** Icon of a graph.
* **Downstream Application:**
* **Robotics:** Icon of a robot head.
* **Multimodal:** Icon of multiple screens.
* **Industry:** Icon of a factory.
* **Math:** Icon of mathematical symbols.
* **Text:** Icon of a document.
* **Code:** Icon of code brackets.
* **Agent:** Icon of a person.
The arrows indicate a cyclical flow, suggesting that the PRM framework is iterative. The "PRM Usage" ring has a curved arrow pointing towards the "Downstream Application" ring.
### Key Observations
The diagram emphasizes the interconnectedness of data processing, PRM training, PRM usage, and downstream applications. The cyclical nature of the diagram suggests a continuous improvement loop. The variety of downstream applications indicates the broad applicability of the PRM framework. The icons provide a quick visual understanding of each segment.
### Interpretation
This diagram illustrates a comprehensive framework for Policy Reinforcement Learning (PRM). It highlights the importance of a robust data process (involving human, automated, and semi-automated methods) as the foundation for effective PRM training. The training phase encompasses both discriminative and generative approaches, leveraging implicit knowledge and architectural design. The trained PRM is then utilized for tasks like test-time scaling and reinforcement learning for policy optimization. Finally, the framework is applied to a diverse range of downstream applications, including robotics, multimodal systems, industry automation, mathematical modeling, text processing, code generation, and agent-based systems.
The cyclical flow suggests that insights gained from downstream applications can be fed back into the data process and PRM training, leading to continuous refinement and improvement of the framework. The diagram is a high-level overview and does not provide specific details about the algorithms or techniques used within each segment. It serves as a conceptual map for understanding the overall structure and relationships within the PRM ecosystem.