## Diagram: PRM (Path Reasoning Model) Ecosystem
### Overview
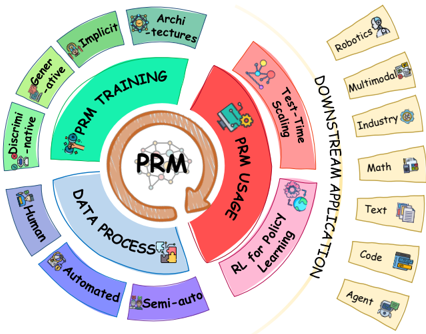
The image is a conceptual circular diagram illustrating the ecosystem of a "PRM" (likely Path Reasoning Model or similar). It depicts a cyclical process centered around the PRM core, branching into three primary phases (Training, Data Process, Usage), which then feed into a wide array of downstream applications. The diagram uses color-coded segments, icons, and text labels to show components, data flow, and relationships.
### Components/Structure
The diagram is organized into concentric rings and radial segments emanating from a central core.
1. **Central Core:**
* **Label:** "PRM"
* **Icon:** A stylized brain with interconnected nodes.
* **Position:** Absolute center of the diagram.
2. **Inner Ring (Primary Phases):** Three large, curved segments surround the core, connected by a circular arrow indicating a cyclical process.
* **Segment 1 (Top-Left, Green):** "PRM TRAINING"
* **Segment 2 (Bottom, Blue):** "DATA PROCESS"
* **Segment 3 (Right, Red):** "PRM USAGE"
3. **Middle Ring (Methods & Sub-processes):** Each primary phase segment has associated methods or sub-processes listed in smaller, adjacent segments.
* **Associated with "PRM TRAINING":**
* "Implicit" (with a brain icon)
* "Self-Supervised" (with a magnifying glass icon)
* "Discriminative" (with a target icon)
* **Associated with "DATA PROCESS":**
* "Human" (with a person icon)
* "Automated" (with a robot icon)
* "Semi-auto" (with a person and robot icon)
* **Associated with "PRM USAGE":**
* "Test-Time Scaling" (with a scaling/chart icon)
* "RL for Policy Learning" (with a reinforcement learning icon)
4. **Outer Ring (Architectures):** A thin, segmented ring outside the primary phases lists architectural considerations.
* **Label:** "Architectures" (with a gear icon)
* **Segments:** This ring is divided but does not contain further text labels within its segments in this view.
5. **Right Side - Downstream Applications:** A vertical list of rectangular boxes, each representing an application domain, connected to the "PRM USAGE" segment by a faint, curved line.
* **Title:** "DOWNSTREAM APPLICATIONS" (written vertically along the connecting line).
* **Applications (from top to bottom):**
* "Robotics" (with a robot arm icon)
* "Multimodal" (with image and text icons)
* "Industry" (with a factory icon)
* "Math" (with a calculator icon)
* "Text" (with a document icon)
* "Code" (with a code brackets icon)
* "Agent" (with a person/avatar icon)
### Detailed Analysis / Content Details
* **Flow & Relationships:** The diagram suggests a continuous cycle: Data is processed (Human, Automated, Semi-auto), used to train the PRM (Implicit, Self-Supervised, Discriminative), and the trained PRM is then used (Test-Time Scaling, RL for Policy Learning) to power various downstream applications. The "Architectures" ring implies these are cross-cutting considerations for the entire system.
* **Color Coding:**
* **Green:** Associated with Training and its methods.
* **Blue:** Associated with Data Processing and its methods.
* **Red/Pink:** Associated with Usage and its methods.
* **Yellow/Beige:** Used for the Downstream Applications list.
* **Brown/Orange:** Used for the central core and the "Architectures" ring.
* **Icons:** Each label is accompanied by a small, simple icon that visually reinforces its meaning (e.g., brain for "Implicit", robot for "Automated", factory for "Industry").
### Key Observations
1. **Cyclical Core:** The central arrow emphasizes that PRM development is not linear but an iterative cycle between data processing, model training, and application.
2. **Breadth of Applications:** The diagram highlights the versatility of the PRM, listing seven distinct and significant application domains, from robotics to code generation.
3. **Methodological Diversity:** Each phase (Training, Data Process, Usage) is shown to have multiple approaches (e.g., three training paradigms, three data sourcing methods), indicating flexibility in implementation.
4. **Spatial Organization:** The "Downstream Applications" are placed outside the main cycle, visually representing them as the output or beneficiaries of the core PRM process. The "Architectures" ring encircles the core processes, suggesting it is a foundational layer.
### Interpretation
This diagram presents a holistic view of a PRM as a central engine within a larger AI system. It argues that such a model is not a standalone artifact but part of an ecosystem:
* **The "What":** The PRM is the core reasoning component.
* **The "How":** It is built and improved through a cycle of diverse data processing and training methodologies.
* **The "Why":** Its purpose is to be deployed at scale ("Test-Time Scaling") and refined through interaction ("RL for Policy Learning") to solve real-world problems across multiple high-impact fields.
The inclusion of "Architectures" as a surrounding ring implies that the design of the model's structure is a critical, overarching concern that influences every stage of the cycle. The diagram effectively communicates that developing and utilizing a PRM is a complex, multi-faceted endeavor requiring integration of data pipelines, training regimes, deployment strategies, and application-specific tuning. The absence of specific numerical data indicates this is a conceptual framework, not a performance report.