## Diagram: PRM Lifecycle and Applications
### Overview
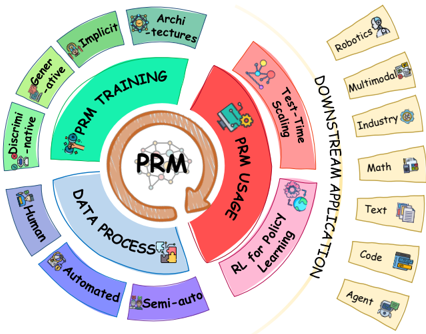
The image is a circular flowchart diagram illustrating the lifecycle and applications of PRM (Probabilistic Reinforcement Learning). It is divided into four main sections: **PRM Training**, **PRM Usage**, **Data Process**, and **Downstream Applications**. Each section contains subcategories, with color-coded labels and a legend on the right. The diagram emphasizes the cyclical nature of PRM, with arrows indicating flow between components.
---
### Components/Axes
#### Legend (Right Side)
- **Colors and Labels**:
- **Green**: Generative, Discriminative, Implicit, Architectures (PRM Training)
- **Red**: Test-Time Scaling, RL for Policy Learning (PRM Usage)
- **Blue**: Human, Automated, Semi-Auto (Data Process)
- **Purple**: Not explicitly labeled (Data Process)
- **Yellow**: Robotics, Multimodal, Industry, Math, Text, Code, Agent (Downstream Applications)
#### Main Sections
1. **PRM Training** (Top-Left, Green):
- Subcategories: Generative, Implicit, Discriminative, Architectures.
2. **PRM Usage** (Top-Right, Red):
- Subcategories: Test-Time Scaling, RL for Policy Learning.
3. **Data Process** (Bottom-Left, Blue/Purple):
- Subcategories: Human, Automated, Semi-Auto.
4. **Downstream Applications** (Right Side, Yellow):
- Subcategories: Robotics, Multimodal, Industry, Math, Text, Code, Agent.
#### Flow
- Arrows connect the sections in a clockwise direction, starting from **PRM Training** → **PRM Usage** → **Data Process** → **Downstream Applications** → back to **PRM Training**.
---
### Detailed Analysis
#### PRM Training (Green)
- **Generative**: Likely refers to models that generate data (e.g., text, images).
- **Implicit**: Training without explicit labels (e.g., unsupervised learning).
- **Discriminative**: Models that distinguish between classes (e.g., classification).
- **Architectures**: Structural designs of PRM systems (e.g., neural network configurations).
#### PRM Usage (Red)
- **Test-Time Scaling**: Adapting PRM models to new, unseen data during inference.
- **RL for Policy Learning**: Using reinforcement learning to optimize decision-making policies.
#### Data Process (Blue/Purple)
- **Human**: Manual intervention in data handling.
- **Automated**: Fully automated data processing pipelines.
- **Semi-Auto**: Hybrid approach combining human and automated steps.
#### Downstream Applications (Yellow)
- **Robotics**: PRM applied to robotic systems (e.g., motion planning).
- **Multimodal**: Integration of multiple data types (e.g., text + images).
- **Industry**: Industrial applications (e.g., manufacturing, logistics).
- **Math**: Mathematical modeling and optimization.
- **Text**: Natural language processing tasks.
- **Code**: Code generation or analysis.
- **Agent**: Autonomous agents (e.g., AI-driven systems).
---
### Key Observations
1. **Cyclical Flow**: The diagram emphasizes the iterative nature of PRM, with feedback loops between training, usage, and applications.
2. **Diverse Subcategories**: Each main section contains distinct subcategories, highlighting the breadth of PRM's applications.
3. **Color Coding**: The legend ensures clarity, with no overlapping colors between sections.
4. **Downstream Applications**: The largest section (7 subcategories) underscores the versatility of PRM across domains.
---
### Interpretation
The diagram illustrates PRM as a **holistic framework** that integrates training, usage, and application phases. The emphasis on **downstream applications** suggests PRM's adaptability to real-world problems, from robotics to text processing. The inclusion of **human, automated, and semi-automated data processes** reflects the balance between flexibility and efficiency in PRM systems. The cyclical flow implies continuous improvement, where feedback from applications informs future training and usage strategies. This structure positions PRM as a **versatile tool** for addressing complex, multi-domain challenges.