## Scatter Plot: Validation Loss vs. FLOPS for Different Model Sizes
### Overview
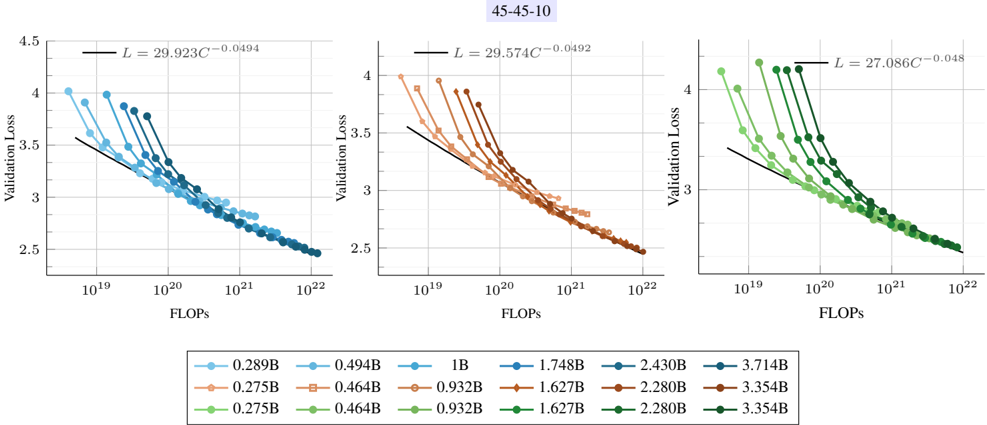
The image presents three scatter plots arranged horizontally, each displaying the relationship between validation loss and FLOPS (Floating Point Operations Per Second) for different model sizes. Each plot contains multiple data series, each representing a specific model size, and a black line representing a power law fit. The plots share the same axes and general structure, but differ in the range of model sizes they depict. The title "45-45-10" is present at the top of the image.
### Components/Axes
* **Title:** 45-45-10 (located at the top-center of the image)
* **X-axis (Horizontal):** FLOPS (Floating Point Operations Per Second). The scale is logarithmic, ranging from approximately 10<sup>19</sup> to 10<sup>22</sup>.
* **Y-axis (Vertical):** Validation Loss. The scale is linear, ranging from 2.5 to 4.5.
* **Data Series:** Each plot contains multiple data series, each represented by a different color and marker. Each series represents a different model size (in billions of parameters, denoted as 'B').
* **Power Law Fit:** Each plot includes a black line representing a power law fit to the data. The equation for the power law is displayed on each plot in the form L = aC<sup>-b</sup>, where L is the validation loss, C is the FLOPS, and a and b are constants.
* **Legend:** Located at the bottom of the image, the legend maps the colors and markers to the corresponding model sizes.
### Detailed Analysis
**Plot 1 (Left):**
* **Power Law Fit:** L = 29.923C<sup>-0.0494</sup>
* **Data Series (from top-left to bottom-right):**
* Light Blue: 0.289B. Starts at approximately (10<sup>19</sup>, 4.0) and decreases to (10<sup>22</sup>, 2.6).
* Orange: 0.275B. Starts at approximately (10<sup>19</sup>, 3.9) and decreases to (10<sup>22</sup>, 2.6).
* Green: 0.275B. Starts at approximately (10<sup>19</sup>, 3.8) and decreases to (10<sup>22</sup>, 2.5).
* Blue: 0.494B. Starts at approximately (10<sup>19</sup>, 3.8) and decreases to (10<sup>22</sup>, 2.6).
* Brown: 0.464B. Starts at approximately (10<sup>19</sup>, 3.7) and decreases to (10<sup>22</sup>, 2.6).
* Dark Green: 0.464B. Starts at approximately (10<sup>19</sup>, 3.6) and decreases to (10<sup>22</sup>, 2.5).
**Plot 2 (Center):**
* **Power Law Fit:** L = 29.574C<sup>-0.0492</sup>
* **Data Series (from top-left to bottom-right):**
* Light Blue: 1B. Starts at approximately (10<sup>19</sup>, 4.0) and decreases to (10<sup>22</sup>, 2.6).
* Orange: 0.932B. Starts at approximately (10<sup>19</sup>, 3.9) and decreases to (10<sup>22</sup>, 2.6).
* Green: 0.932B. Starts at approximately (10<sup>19</sup>, 3.8) and decreases to (10<sup>22</sup>, 2.5).
* Blue: 1.748B. Starts at approximately (10<sup>19</sup>, 3.7) and decreases to (10<sup>22</sup>, 2.6).
* Brown: 1.627B. Starts at approximately (10<sup>19</sup>, 3.6) and decreases to (10<sup>22</sup>, 2.6).
* Dark Green: 1.627B. Starts at approximately (10<sup>19</sup>, 3.5) and decreases to (10<sup>22</sup>, 2.5).
**Plot 3 (Right):**
* **Power Law Fit:** L = 27.086C<sup>-0.048</sup>
* **Data Series (from top-left to bottom-right):**
* Light Blue: 2.430B. Starts at approximately (10<sup>19</sup>, 4.2) and decreases to (10<sup>22</sup>, 2.6).
* Orange: 2.280B. Starts at approximately (10<sup>19</sup>, 4.0) and decreases to (10<sup>22</sup>, 2.6).
* Green: 2.280B. Starts at approximately (10<sup>19</sup>, 3.9) and decreases to (10<sup>22</sup>, 2.5).
* Blue: 3.714B. Starts at approximately (10<sup>19</sup>, 3.8) and decreases to (10<sup>22</sup>, 2.6).
* Brown: 3.354B. Starts at approximately (10<sup>19</sup>, 3.7) and decreases to (10<sup>22</sup>, 2.6).
* Dark Green: 3.354B. Starts at approximately (10<sup>19</sup>, 3.6) and decreases to (10<sup>22</sup>, 2.5).
### Key Observations
* **Inverse Relationship:** There is a clear inverse relationship between FLOPS and validation loss. As FLOPS increase, validation loss decreases.
* **Power Law Behavior:** The power law fit suggests that the relationship between FLOPS and validation loss can be modeled by a power law function.
* **Model Size Impact:** For a given FLOPS value, larger models (higher 'B' value) tend to have lower validation loss.
* **Saturation:** The validation loss appears to saturate at higher FLOPS values, meaning that increasing FLOPS beyond a certain point yields diminishing returns in terms of reducing validation loss.
* **Similar Trends:** The trends are very similar across the three plots, suggesting that the relationship between FLOPS and validation loss is consistent across different ranges of model sizes.
* **Power Law Exponents:** The exponents in the power law fits are similar across the three plots (-0.0494, -0.0492, -0.048), suggesting a similar rate of decrease in validation loss with increasing FLOPS.
### Interpretation
The plots demonstrate the relationship between computational effort (FLOPS) and model performance (validation loss) for different model sizes. The data suggests that increasing the computational effort invested in training a model leads to a reduction in validation loss, following a power law relationship. Furthermore, larger models tend to achieve lower validation loss for a given amount of computation. The saturation effect indicates that there are limits to the benefits of increasing FLOPS, and that other factors, such as model architecture or training data, may become more important at higher levels of computation. The consistency of the trends across the three plots suggests that these relationships are robust and generalizable across different model size ranges. The title "45-45-10" likely refers to specific experimental parameters or configurations used in the study.