# Technical Analysis of Entity Frequency Distribution
## Chart Description
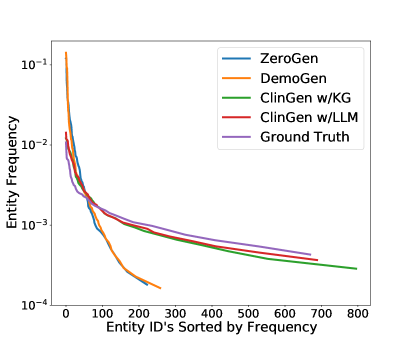
The image is a **line graph** comparing the frequency distribution of entities across different models/datasets. The x-axis represents **Entity ID's Sorted by Frequency** (0–800), and the y-axis represents **Entity Frequency** on a logarithmic scale (10⁻⁴ to 10⁻¹).
---
## Key Components
### Axis Labels
- **X-axis**: "Entity ID's Sorted by Frequency" (0–800)
- **Y-axis**: "Entity Frequency" (log scale: 10⁻⁴ to 10⁻¹)
### Legend
| Color | Label |
|--------|---------------------|
| Blue | ZeroGen |
| Orange | DemoGen |
| Green | ClinGen w/KG |
| Red | ClinGen w/LLM |
| Purple | Ground Truth |
---
## Data Trends
1. **Initial Drop**:
- All lines exhibit a steep decline at the start (Entity IDs 0–100), indicating high-frequency entities dominate.
- **DemoGen (orange)** and **ZeroGen (blue)** show the sharpest initial drop, suggesting they prioritize the most frequent entities.
2. **Mid-Range Performance**:
- **ClinGen w/KG (green)** and **ClinGen w/LLM (red)** maintain higher frequencies across a broader range of Entity IDs compared to ZeroGen/DemoGen.
- These lines closely follow the **Ground Truth (purple)**, indicating better alignment with real-world distributions.
3. **Long-Tail Behavior**:
- **DemoGen (orange)** and **ZeroGen (blue)** diverge significantly from the Ground Truth at Entity IDs >200, showing rapid frequency decay.
- **ClinGen w/KG (green)** and **ClinGen w/LLM (red)** retain closer proximity to the Ground Truth up to Entity ID ~700, suggesting better coverage of less frequent entities.
4. **Ground Truth**:
- The **purple line** (Ground Truth) serves as the reference, showing a smooth, gradual decline. All models approximate this trend to varying degrees.
---
## Observations
- **DemoGen** and **ZeroGen** prioritize high-frequency entities but underperform for less frequent ones.
- **ClinGen w/KG** and **ClinGen w/LLM** improve long-tail coverage, with the latter (LLM-enhanced) showing marginally better alignment with Ground Truth.
- The logarithmic y-axis emphasizes differences in frequency decay rates, particularly for low-frequency entities.
---
## Conclusion
The graph highlights trade-offs between model performance: ZeroGen/DemoGen excel at capturing high-frequency entities but fail for rare ones, while ClinGen variants (especially with LLM) better approximate the Ground Truth distribution across the full spectrum of Entity IDs.