## Chart/Diagram Type: Multi-Panel Performance Evaluation
### Overview
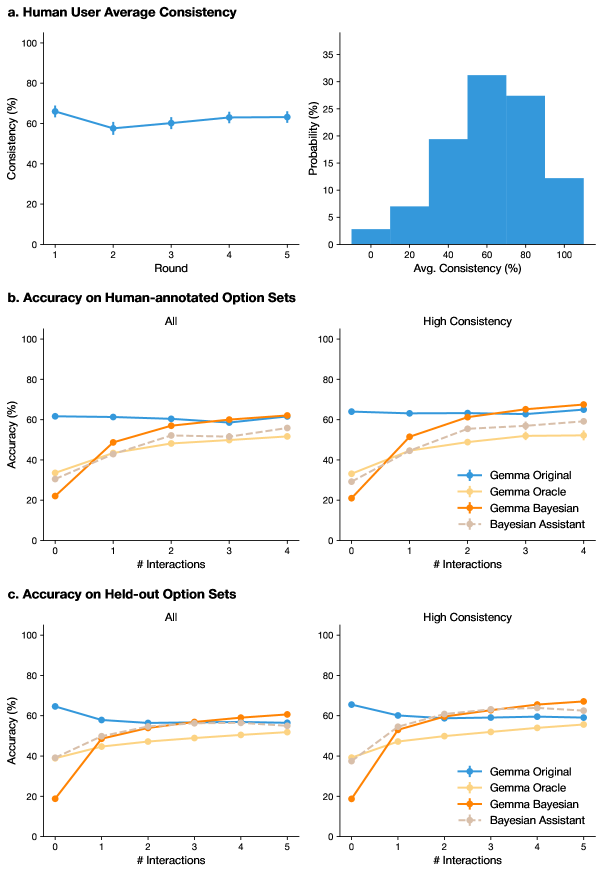
The image presents a multi-panel figure evaluating the performance of different models (Gemma Original, Gemma Oracle, Gemma Bayesian, and Bayesian Assistant) in terms of human user consistency and accuracy on both human-annotated and held-out option sets. The figure is divided into three sections: (a) Human User Average Consistency, (b) Accuracy on Human-annotated Option Sets, and (c) Accuracy on Held-out Option Sets. Each accuracy section is further divided into "All" and "High Consistency" subsets.
### Components/Axes
**Panel a: Human User Average Consistency**
* **Title:** Human User Average Consistency
* **X-axis:** Round (values: 1, 2, 3, 4, 5)
* **Y-axis:** Consistency (%) (range: 0 to 100)
* **Data:** A single data series showing consistency across rounds. Error bars are present.
**Panel a: Histogram of Average Consistency**
* **X-axis:** Avg. Consistency (%) (range: 0 to 100)
* **Y-axis:** Probability (%) (range: 0 to 35)
**Panel b: Accuracy on Human-annotated Option Sets**
* **Title:** Accuracy on Human-annotated Option Sets
* **Subtitles:** All, High Consistency
* **X-axis:** # Interactions (values: 0, 1, 2, 3, 4)
* **Y-axis:** Accuracy (%) (range: 0 to 100)
* **Legend (right side of the panel):**
* Blue: Gemma Original
* Light Blue: Gemma Oracle
* Orange: Gemma Bayesian
* Gray Dashed: Bayesian Assistant
**Panel c: Accuracy on Held-out Option Sets**
* **Title:** Accuracy on Held-out Option Sets
* **Subtitles:** All, High Consistency
* **X-axis:** # Interactions (values: 0, 1, 2, 3, 4, 5)
* **Y-axis:** Accuracy (%) (range: 0 to 100)
* **Legend (right side of the panel):**
* Blue: Gemma Original
* Light Blue: Gemma Oracle
* Orange: Gemma Bayesian
* Gray Dashed: Bayesian Assistant
### Detailed Analysis
**Panel a: Human User Average Consistency**
* The consistency starts at approximately 67% in Round 1.
* It dips to around 58% in Round 2.
* Then, it gradually increases and stabilizes around 63% for Rounds 3, 4, and 5.
* The error bars indicate the variability in consistency across users.
**Panel a: Histogram of Average Consistency**
* The histogram shows the distribution of average consistency scores.
* The distribution is unimodal and skewed to the right.
* The highest probability is around 60-70% consistency.
* The probability is low for consistency scores below 20% and above 90%.
* Approximate probability values:
* 0-20%: ~3%
* 20-40%: ~7%
* 40-60%: ~19%
* 60-80%: ~32%
* 80-100%: ~12%
**Panel b: Accuracy on Human-annotated Option Sets**
* **"All" Subpanel:**
* Gemma Original (Blue): Starts at approximately 62% and remains relatively constant.
* Gemma Oracle (Light Blue): Starts around 30%, increases to approximately 55% by interaction 1, and plateaus.
* Gemma Bayesian (Orange): Starts around 22%, increases to approximately 50% by interaction 1, and plateaus.
* Bayesian Assistant (Gray Dashed): Starts around 35%, increases to approximately 58% by interaction 1, and plateaus.
* **"High Consistency" Subpanel:**
* Gemma Original (Blue): Starts at approximately 64% and remains relatively constant.
* Gemma Oracle (Light Blue): Starts around 30%, increases to approximately 60% by interaction 1, and plateaus.
* Gemma Bayesian (Orange): Starts around 20%, increases to approximately 65% by interaction 2, and plateaus.
* Bayesian Assistant (Gray Dashed): Starts around 35%, increases to approximately 60% by interaction 1, and plateaus.
**Panel c: Accuracy on Held-out Option Sets**
* **"All" Subpanel:**
* Gemma Original (Blue): Starts at approximately 65% and decreases slightly to approximately 60% by interaction 5.
* Gemma Oracle (Light Blue): Starts around 40%, increases to approximately 58% by interaction 2, and plateaus.
* Gemma Bayesian (Orange): Starts around 18%, increases to approximately 60% by interaction 4, and plateaus.
* Bayesian Assistant (Gray Dashed): Starts around 40%, increases to approximately 55% by interaction 1, and plateaus.
* **"High Consistency" Subpanel:**
* Gemma Original (Blue): Starts at approximately 65% and decreases slightly to approximately 60% by interaction 5.
* Gemma Oracle (Light Blue): Starts around 40%, increases to approximately 60% by interaction 1, and plateaus.
* Gemma Bayesian (Orange): Starts around 20%, increases to approximately 65% by interaction 3, and plateaus.
* Bayesian Assistant (Gray Dashed): Starts around 40%, increases to approximately 55% by interaction 1, and plateaus.
### Key Observations
* Gemma Original consistently maintains a higher accuracy compared to other models across all conditions, but does not improve with interactions.
* Gemma Oracle, Gemma Bayesian, and Bayesian Assistant show improvement in accuracy with increasing interactions, but plateau after a few interactions.
* The "High Consistency" subsets generally show slightly higher accuracy for Gemma Oracle, Gemma Bayesian, and Bayesian Assistant compared to the "All" subsets.
* The accuracy of Gemma Original on held-out option sets decreases slightly with more interactions.
### Interpretation
The data suggests that Gemma Original performs well without any interactions, possibly due to pre-training or inherent biases. The other models (Gemma Oracle, Gemma Bayesian, and Bayesian Assistant) benefit from interactions with human-annotated data, improving their accuracy. The "High Consistency" subsets indicate that these models perform better when trained on more reliable data. The slight decrease in Gemma Original's accuracy on held-out option sets with more interactions might indicate overfitting or a shift in the data distribution. The histogram of average consistency shows that most users have a consistency score between 40% and 80%, indicating a moderate level of agreement among annotators.