## Charts: Model Performance & Human Consistency
### Overview
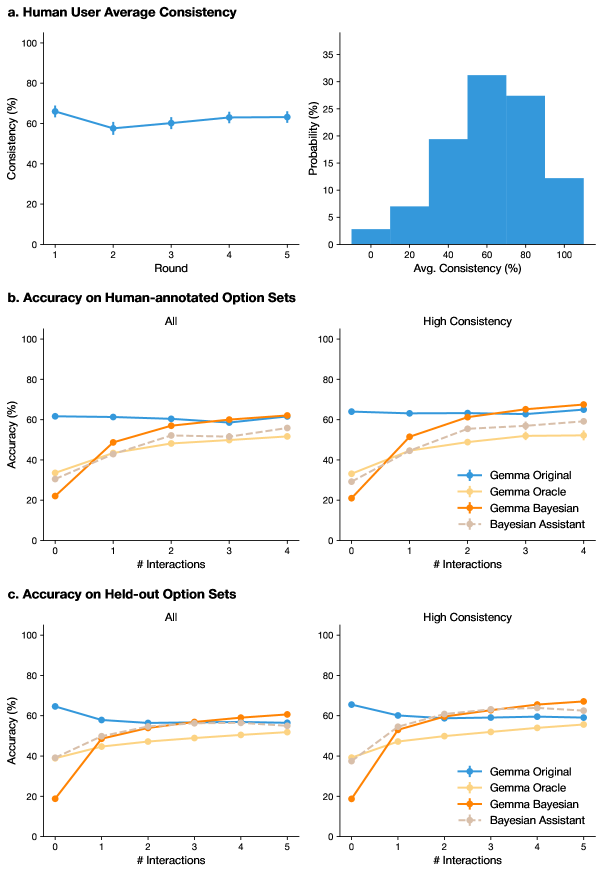
The image contains three charts evaluating the performance of different models (Gemma Original, Gemma Oracle, Gemma Bayesian, and Bayesian Assistant) in relation to human user consistency. The charts assess accuracy on both human-annotated and held-out option sets, under both all consistency levels and high consistency levels. The first chart (a) shows the distribution of human user average consistency.
### Components/Axes
* **Chart a:**
* **X-axis:** Round (1 to 5)
* **Y-axis:** Consistency (%)
* **Chart Type:** Line graph and Histogram
* **Charts b & c:**
* **X-axis:** # Interactions (0 to 4/5)
* **Y-axis:** Accuracy (%)
* **Chart Type:** Line graph
* **Legend:**
* Gemma Original (Blue)
* Gemma Oracle (Orange)
* Gemma Bayesian (Yellow)
* Bayesian Assistant (Brown)
* **Sub-Charts:** Each chart (b & c) is split into two sub-charts: "All" and "High Consistency".
### Detailed Analysis or Content Details
**Chart a: Human User Average Consistency**
* The line graph shows a decreasing trend in consistency from Round 1 to Round 5.
* Round 1: Approximately 75% consistency.
* Round 2: Approximately 60% consistency.
* Round 3: Approximately 50% consistency.
* Round 4: Approximately 45% consistency.
* Round 5: Approximately 40% consistency.
* The histogram shows the probability distribution of average consistency percentages.
* The distribution is right-skewed, with a peak between 60% and 80%.
* The probability decreases as consistency decreases below 60%.
* The probability is low for consistency above 80%.
**Chart b: Accuracy on Human-annotated Option Sets**
* **All:**
* Gemma Original: Starts at approximately 65% accuracy and remains relatively stable around 60-70% across all interactions.
* Gemma Oracle: Starts at approximately 20% accuracy and increases to around 40% by interaction 4.
* Gemma Bayesian: Starts at approximately 20% accuracy and increases to around 50% by interaction 4.
* Bayesian Assistant: Starts at approximately 20% accuracy and increases to around 45% by interaction 4.
* **High Consistency:**
* Gemma Original: Starts at approximately 60% accuracy and increases to around 70% by interaction 4.
* Gemma Oracle: Starts at approximately 40% accuracy and remains relatively stable around 40-50% across all interactions.
* Gemma Bayesian: Starts at approximately 40% accuracy and increases to around 60% by interaction 4.
* Bayesian Assistant: Starts at approximately 40% accuracy and increases to around 60% by interaction 4.
**Chart c: Accuracy on Held-out Option Sets**
* **All:**
* Gemma Original: Starts at approximately 60% accuracy and decreases to around 40% by interaction 5.
* Gemma Oracle: Starts at approximately 20% accuracy and increases to around 40% by interaction 3, then plateaus.
* Gemma Bayesian: Starts at approximately 20% accuracy and increases to around 40% by interaction 3, then plateaus.
* Bayesian Assistant: Starts at approximately 20% accuracy and increases to around 40% by interaction 3, then plateaus.
* **High Consistency:**
* Gemma Original: Starts at approximately 40% accuracy and increases to around 60% by interaction 2, then plateaus.
* Gemma Oracle: Starts at approximately 20% accuracy and increases to around 50% by interaction 3, then plateaus.
* Gemma Bayesian: Starts at approximately 20% accuracy and increases to around 50% by interaction 3, then plateaus.
* Bayesian Assistant: Starts at approximately 20% accuracy and increases to around 50% by interaction 3, then plateaus.
### Key Observations
* Human consistency decreases with each round of interaction.
* Gemma Original consistently performs well on human-annotated and held-out option sets, especially under high consistency conditions.
* Gemma Oracle, Gemma Bayesian, and Bayesian Assistant show improvement with more interactions, but generally perform lower than Gemma Original.
* Accuracy is generally higher for high consistency data compared to all data.
* The "All" data in Chart c shows Gemma Original's accuracy decreasing with more interactions, while the "High Consistency" data shows it plateauing.
### Interpretation
The data suggests that while human consistency diminishes over repeated interactions, the models, particularly Gemma Original, can maintain or even improve accuracy, especially when dealing with consistent human input. The improvement of Gemma Oracle, Bayesian and Assistant with more interactions suggests they benefit from learning, but are still less robust than Gemma Original. The divergence in Gemma Original's performance between the "All" and "High Consistency" datasets in Chart c indicates that the model is more sensitive to inconsistent human input. This could be due to the model being trained on more consistent data, or it could be a limitation of the model's ability to handle noisy data. The histogram in Chart a highlights the inherent variability in human judgment, which is a crucial factor to consider when evaluating model performance. The models' performance is clearly tied to the quality and consistency of the human input.