## Bar Chart: Number of Questions vs. Length of Paths in SPARQL
### Overview
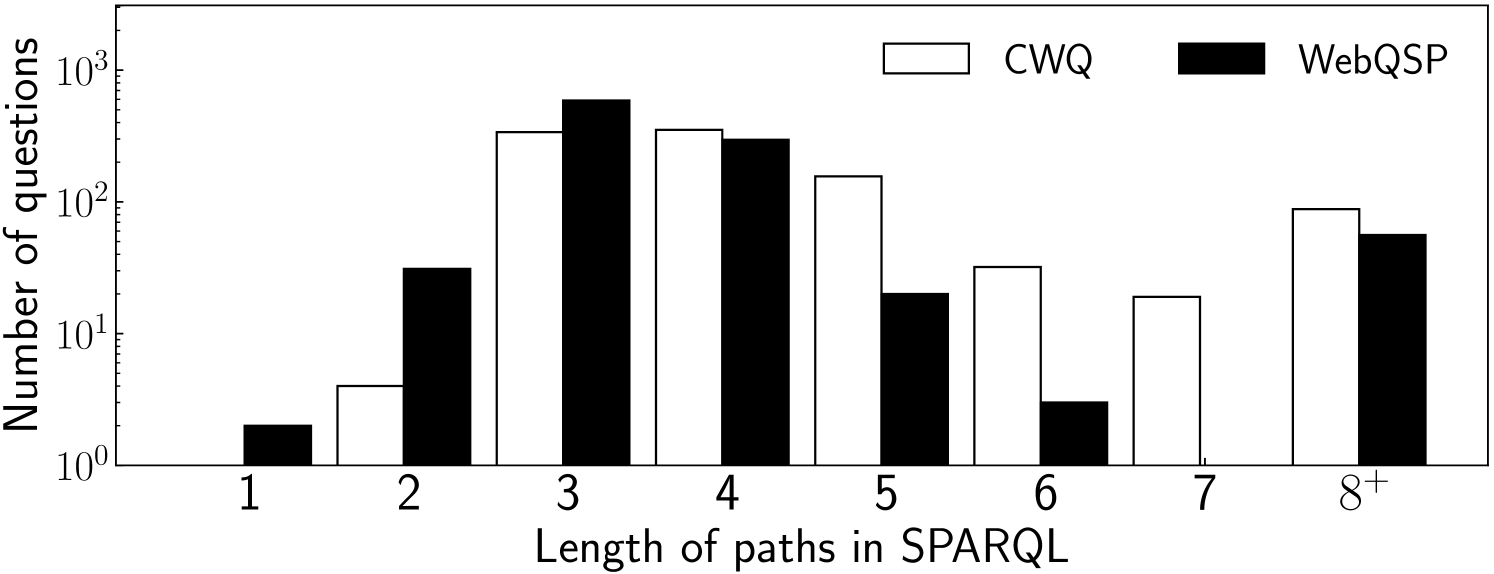
The image is a bar chart comparing the number of questions for different lengths of paths in SPARQL for two datasets: CWQ (white bars) and WebQSP (black bars). The y-axis (Number of questions) is on a logarithmic scale. The x-axis represents the length of paths in SPARQL, ranging from 1 to 8.
### Components/Axes
* **Title:** Implicit, but the chart shows the relationship between the number of questions and the length of paths in SPARQL.
* **X-axis:** Length of paths in SPARQL, with values 1, 2, 3, 4, 5, 6, 7, and '8+'.
* **Y-axis:** Number of questions, with a logarithmic scale. The axis markers are at 10^0 (1), 10^1 (10), and 10^2 (100).
* **Legend:** Located at the top-right of the chart.
* CWQ: Represented by white bars.
* WebQSP: Represented by black bars.
### Detailed Analysis
Here's a breakdown of the data for each path length:
* **Path Length 1:**
* CWQ: Approximately 2 questions.
* WebQSP: Approximately 3 questions.
* **Path Length 2:**
* CWQ: Approximately 3 questions.
* WebQSP: Approximately 30 questions.
* **Path Length 3:**
* CWQ: Approximately 250 questions.
* WebQSP: Approximately 400 questions.
* **Path Length 4:**
* CWQ: Approximately 200 questions.
* WebQSP: Approximately 180 questions.
* **Path Length 5:**
* CWQ: Approximately 120 questions.
* WebQSP: Approximately 20 questions.
* **Path Length 6:**
* CWQ: Approximately 20 questions.
* WebQSP: Approximately 3 questions.
* **Path Length 7:**
* CWQ: Approximately 20 questions.
* WebQSP: Not present.
* **Path Length 8+:**
* CWQ: Approximately 80 questions.
* WebQSP: Approximately 60 questions.
### Key Observations
* For path lengths 1 and 2, the number of questions is significantly lower compared to path lengths 3 and 4.
* Both CWQ and WebQSP peak at path lengths 3 and 4.
* WebQSP has a higher number of questions for path lengths 2 and 3 compared to CWQ.
* CWQ has a higher number of questions for path lengths 5, 7, and 8+ compared to WebQSP.
* The number of questions decreases significantly for both datasets after path length 4, except for CWQ at path length 8+.
### Interpretation
The chart illustrates the distribution of question complexity, as measured by the length of paths in SPARQL queries, across two datasets (CWQ and WebQSP). The data suggests that both datasets contain a significant number of questions that require paths of length 3 and 4. The difference in distributions between CWQ and WebQSP indicates that WebQSP contains more questions with shorter paths (2 and 3), while CWQ has a higher proportion of questions with longer paths (5, 7, and 8+). This could reflect differences in the types of questions or the structure of the knowledge graphs used in each dataset. The logarithmic scale emphasizes the relative differences in the number of questions, highlighting the dominance of path lengths 3 and 4.