\n
## Bar Chart: Distribution of SPARQL Path Lengths for Question Datasets
### Overview
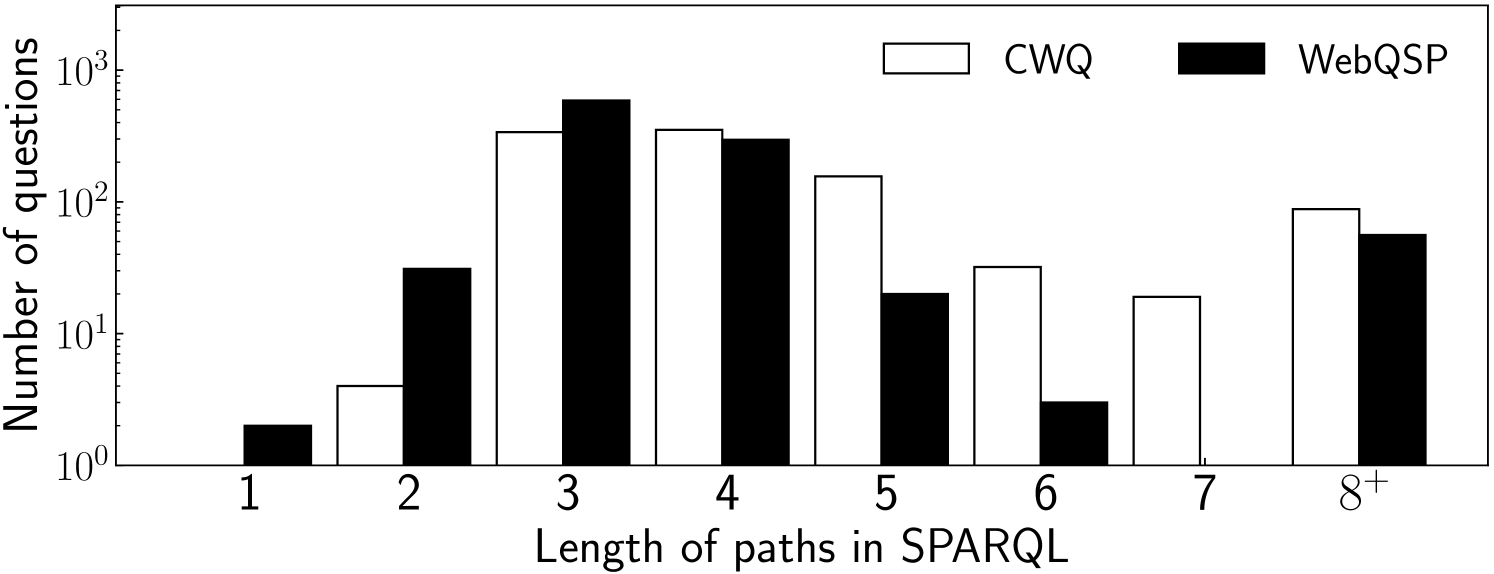
This bar chart displays the distribution of SPARQL path lengths for two question datasets: CWQ and WebQSP. The x-axis represents the length of paths in SPARQL, ranging from 1 to 8. The y-axis represents the number of questions, displayed on a logarithmic scale. The chart uses paired bars for each path length, one for CWQ (white) and one for WebQSP (black).
### Components/Axes
* **X-axis Title:** "Length of paths in SPARQL"
* **X-axis Markers:** 1, 2, 3, 4, 5, 6, 7, 8
* **Y-axis Title:** "Number of questions"
* **Y-axis Scale:** Logarithmic, ranging from 1.0 to 10^2 (100).
* **Legend:** Located at the top-right of the chart.
* **CWQ:** Represented by a white bar.
* **WebQSP:** Represented by a black bar.
### Detailed Analysis
The chart presents paired bars for each SPARQL path length. I will analyze each path length individually, noting the approximate values based on the logarithmic scale.
* **Path Length 1:** CWQ has approximately 2 questions, WebQSP has approximately 1 question.
* **Path Length 2:** CWQ has approximately 4 questions, WebQSP has approximately 8 questions.
* **Path Length 3:** CWQ has approximately 18 questions, WebQSP has approximately 32 questions.
* **Path Length 4:** CWQ has approximately 14 questions, WebQSP has approximately 25 questions.
* **Path Length 5:** CWQ has approximately 7 questions, WebQSP has approximately 16 questions.
* **Path Length 6:** CWQ has approximately 4 questions, WebQSP has approximately 3 questions.
* **Path Length 7:** CWQ has approximately 3 questions, WebQSP has approximately 0 questions.
* **Path Length 8:** CWQ has approximately 10 questions, WebQSP has approximately 10 questions.
**Trend Analysis:**
* **CWQ:** The number of questions generally increases from path length 1 to 3, then decreases from path length 3 to 6, and then increases again at path length 8.
* **WebQSP:** The number of questions increases from path length 1 to 3, then decreases from path length 3 to 6, and then increases again at path length 8.
### Key Observations
* WebQSP generally has a higher number of questions than CWQ for path lengths 1-6.
* Both datasets show a peak in the number of questions around path length 3.
* Both datasets show a similar trend of increasing questions up to path length 3, then decreasing, and then increasing again at path length 8.
* The logarithmic scale is crucial for interpreting the differences in the number of questions, as the differences appear larger for smaller path lengths.
### Interpretation
The chart illustrates the distribution of SPARQL path lengths required to answer questions from the CWQ and WebQSP datasets. The peak at path length 3 suggests that many questions in both datasets can be answered with relatively short SPARQL queries. The differences between the datasets indicate that WebQSP questions, on average, require slightly more complex SPARQL queries (longer paths) than CWQ questions, especially for path lengths 1-6. The increase in questions at path length 8 for both datasets could indicate a subset of questions that require significantly more complex reasoning or involve multiple relationships. The use of a logarithmic scale highlights the relative differences in question counts across different path lengths, revealing that the number of questions drops off significantly as the path length increases. This suggests that the datasets are biased towards questions that can be answered with shorter, simpler SPARQL queries.