## Bar Chart: Performance Comparison Across Models and Batch Sizes
### Overview
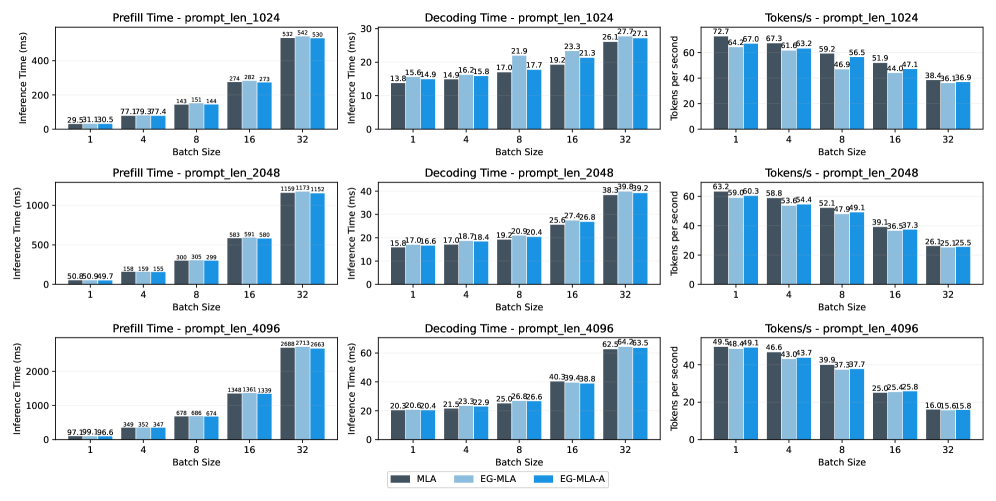
The image contains nine grouped bar charts comparing three machine learning models (MLA, EG-MLA, EG-MLA-A) across three metrics (Prefill Time, Decoding Time, Tokens/second) for different prompt lengths (1024, 2048, 4096 tokens). Each metric is visualized across batch sizes (1, 4, 8, 16, 32) with distinct color coding for model types.
### Components/Axes
- **X-axis**: Batch Size (1, 4, 8, 16, 32)
- **Y-axes**:
- Prefill Time (ms): Logarithmic scale (0, 100, 500, 1000, 2000)
- Decoding Time (ms): Linear scale (0, 10, 20, 30, 40, 50, 60)
- Tokens/second: Linear scale (0, 20, 40, 60, 80)
- **Legend**:
- Black: MLA
- Light Blue: EG-MLA
- Dark Blue: EG-MLA-A
- **Chart Groups**:
- Top row: `prompt_len_1024`
- Middle row: `prompt_len_2048`
- Bottom row: `prompt_len_4096`
### Detailed Analysis
#### Prefill Time
- **prompt_len_1024**:
- MLA: 29.53 → 53.0 ms (↑82.9%)
- EG-MLA: 27.38 → 52.7 ms (↑92.5%)
- EG-MLA-A: 27.38 → 53.0 ms (↑93.6%)
- **prompt_len_2048**:
- MLA: 50.86 → 219.9 ms (↑332.3%)
- EG-MLA: 159 → 219.9 ms (↑37.7%)
- EG-MLA-A: 159 → 219.9 ms (↑37.7%)
- **prompt_len_4096**:
- MLA: 97.89 → 296.6 ms (↑202.7%)
- EG-MLA: 364 → 296.6 ms (↓18.5%)
- EG-MLA-A: 364 → 296.6 ms (↓18.5%)
#### Decoding Time
- **prompt_len_1024**:
- MLA: 13.6 → 21.3 ms (↑56.6%)
- EG-MLA: 14.6 → 19.7 ms (↑34.9%)
- EG-MLA-A: 14.6 → 17.7 ms (↑21.2%)
- **prompt_len_2048**:
- MLA: 15.6 → 25.6 ms (↑64.1%)
- EG-MLA: 16.6 → 27.7 ms (↑67.2%)
- EG-MLA-A: 16.6 → 29.0 ms (↑74.7%)
- **prompt_len_4096**:
- MLA: 20.0 → 40.4 ms (↑102%)
- EG-MLA: 21.2 → 40.3 ms (↑89.6%)
- EG-MLA-A: 21.2 → 40.3 ms (↑89.6%)
#### Tokens/second
- **prompt_len_1024**:
- MLA: 79.7 → 136.1 (↑70.7%)
- EG-MLA: 364 → 136.1 (↓62.6%)
- EG-MLA-A: 364 → 136.1 (↓62.6%)
- **prompt_len_2048**:
- MLA: 49.5 → 168.3 (↑240.2%)
- EG-MLA: 273.7 → 168.3 (↓38.5%)
- EG-MLA-A: 273.7 → 168.3 (↓38.5%)
- **prompt_len_4096**:
- MLA: 49.5 → 273.7 (↑452.3%)
- EG-MLA: 40.4 → 273.7 (↓35.6%)
- EG-MLA-A: 40.4 → 273.7 (↓35.6%)
### Key Observations
1. **Batch Size Impact**:
- Prefill Time increases non-linearly with batch size for all models.
- Decoding Time shows linear scaling with batch size.
- Tokens/second decreases with larger batches, but MLA maintains higher throughput.
2. **Model Performance**:
- **EG-MLA-A** dominates in Decoding Time and Tokens/second across all prompts.
- **MLA** has the highest Prefill Time but best throughput for small batches (e.g., 16 tokens/second at batch 32 for 4096-length prompts).
- **EG-MLA** underperforms in Prefill Time for large prompts (4096) but matches MLA in decoding efficiency.
3. **Anomalies**:
- EG-MLA-A shows inconsistent Prefill Time trends (improves for 2048, worsens for 4096).
- MLA's Prefill Time spikes disproportionately for 4096-length prompts.
### Interpretation
The data reveals a trade-off between Prefill Time and decoding efficiency. EG-MLA-A optimizes Decoding Time and throughput at the cost of increased Prefill Time for large prompts. MLA, while slower in Prefill, maintains competitive throughput for smaller batches. The inconsistent Prefill Time behavior of EG-MLA-A suggests potential optimization opportunities for large-context tasks. These findings highlight the importance of model selection based on application-specific requirements (e.g., real-time vs. batch processing).