## Line Chart: Pass Rate vs. Steps for SFT and RL Priors
### Overview
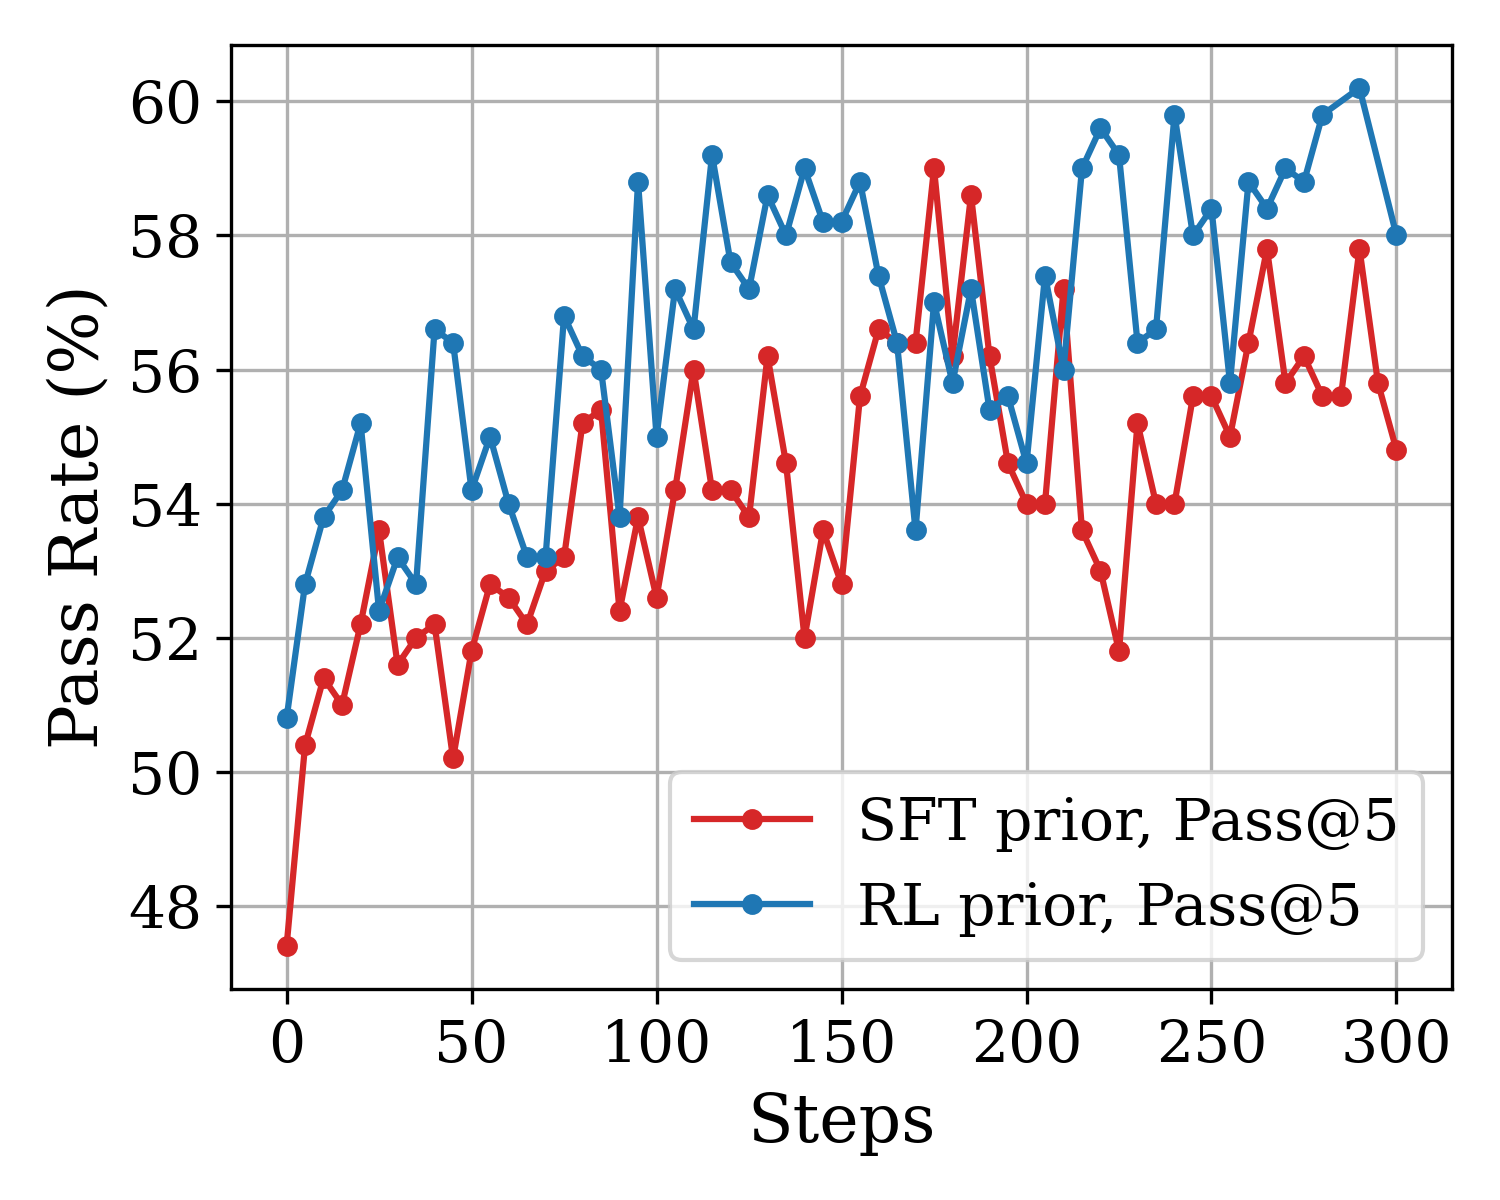
The image is a line chart comparing the "Pass Rate (%)" against "Steps" for two different methods: "SFT prior, Pass@5" and "RL prior, Pass@5". The chart displays how the pass rate changes over the number of steps for each method.
### Components/Axes
* **X-axis (Horizontal):** "Steps", with labeled markers at 0, 50, 100, 150, 200, 250, and 300.
* **Y-axis (Vertical):** "Pass Rate (%)", with labeled markers at 48, 50, 52, 54, 56, 58, and 60.
* **Gridlines:** Present on the chart, aiding in value estimation.
* **Legend (Bottom):**
* Red line: "SFT prior, Pass@5"
* Blue line: "RL prior, Pass@5"
### Detailed Analysis
* **SFT prior, Pass@5 (Red Line):**
* **Trend:** Generally increasing, but with significant fluctuations.
* **Data Points:**
* At 0 Steps: Approximately 47.5%
* At 50 Steps: Approximately 52%
* At 100 Steps: Approximately 52.5%
* At 150 Steps: Approximately 52%
* At 200 Steps: Approximately 56%
* At 250 Steps: Approximately 55%
* At 300 Steps: Approximately 58%
* **RL prior, Pass@5 (Blue Line):**
* **Trend:** Generally increasing, with fluctuations, and consistently higher than the SFT prior.
* **Data Points:**
* At 0 Steps: Approximately 50.5%
* At 50 Steps: Approximately 54%
* At 100 Steps: Approximately 57%
* At 150 Steps: Approximately 59%
* At 200 Steps: Approximately 56%
* At 250 Steps: Approximately 59%
* At 300 Steps: Approximately 60%
### Key Observations
* The RL prior (blue line) generally outperforms the SFT prior (red line) in terms of pass rate across the observed steps.
* Both methods exhibit volatility in their pass rates, indicated by the fluctuations in the lines.
* The RL prior shows a more pronounced initial increase in pass rate compared to the SFT prior.
### Interpretation
The chart suggests that the "RL prior, Pass@5" method is more effective than the "SFT prior, Pass@5" method in achieving a higher pass rate, especially in the early stages (lower number of steps). The fluctuations in both lines indicate that the pass rate is not consistently improving and may be influenced by other factors or inherent variability in the methods. The data implies that using a Reinforcement Learning (RL) prior leads to better performance compared to using a Supervised Fine-Tuning (SFT) prior, given the "Pass@5" metric. Further investigation could explore the reasons for the fluctuations and potential optimizations for both methods.