\n
## Line Chart: Pass Rate vs. Steps
### Overview
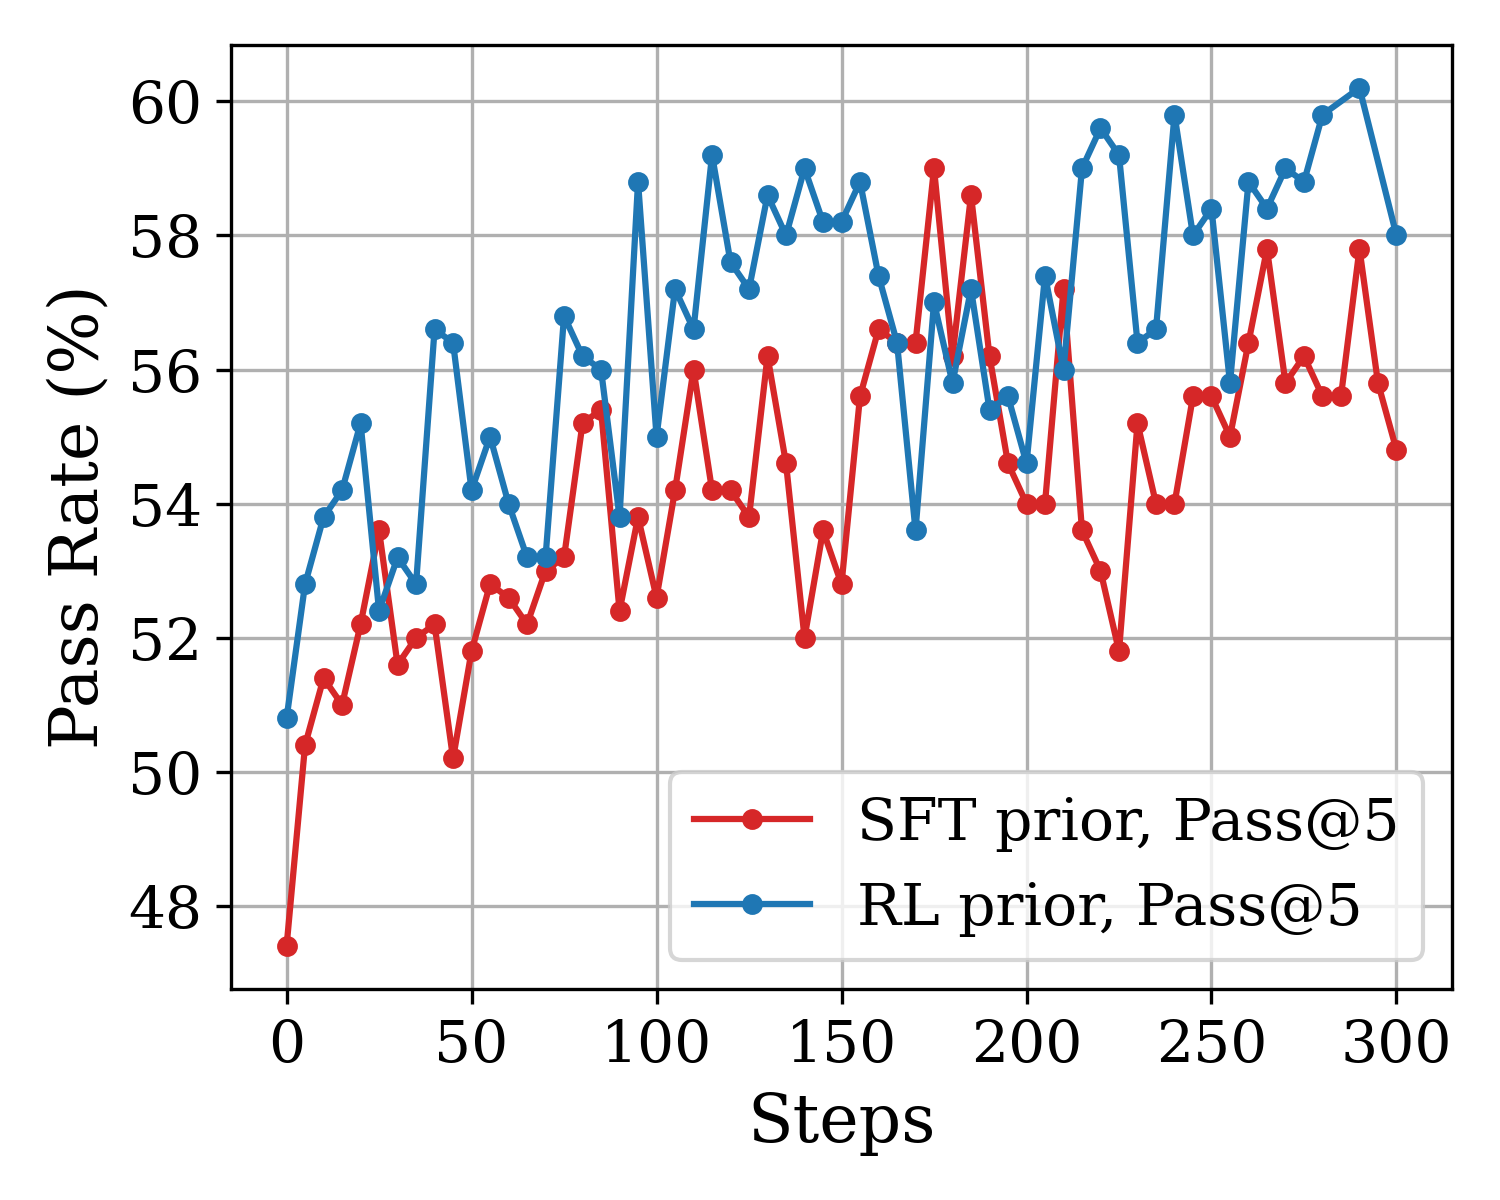
This image presents a line chart comparing the "Pass@5" rate of two models, "SFT prior" and "RL prior", over a range of "Steps" from 0 to 300. The chart visualizes the performance of these models as they undergo training or iterative improvement.
### Components/Axes
* **X-axis:** "Steps" - ranging from 0 to 300, with gridlines at intervals of 50.
* **Y-axis:** "Pass Rate (%)" - ranging from 48% to 60%, with gridlines at intervals of 2%.
* **Data Series 1:** "SFT prior, Pass@5" - represented by a red line with circular markers.
* **Data Series 2:** "RL prior, Pass@5" - represented by a blue line with circular markers.
* **Legend:** Located in the bottom-right corner, clearly labeling each data series with its corresponding color.
### Detailed Analysis
**SFT prior, Pass@5 (Red Line):**
The red line initially shows a steep increase from approximately 47% at Step 0 to around 52% at Step 20. It then fluctuates between approximately 52% and 59% for the remainder of the steps.
* Step 0: ~47%
* Step 20: ~52%
* Step 40: ~53%
* Step 60: ~55%
* Step 80: ~56%
* Step 100: ~54%
* Step 120: ~57%
* Step 140: ~58%
* Step 160: ~56%
* Step 180: ~59%
* Step 200: ~55%
* Step 220: ~53%
* Step 240: ~56%
* Step 260: ~55%
* Step 280: ~56%
* Step 300: ~55%
**RL prior, Pass@5 (Blue Line):**
The blue line starts at approximately 55% at Step 0 and generally maintains a higher pass rate than the red line throughout the observed steps. It fluctuates between approximately 54% and 60%.
* Step 0: ~55%
* Step 20: ~56%
* Step 40: ~57%
* Step 60: ~59%
* Step 80: ~58%
* Step 100: ~56%
* Step 120: ~59%
* Step 140: ~60%
* Step 160: ~58%
* Step 180: ~59%
* Step 200: ~57%
* Step 220: ~58%
* Step 240: ~59%
* Step 260: ~58%
* Step 280: ~59%
* Step 300: ~60%
### Key Observations
* The "RL prior" model consistently achieves a higher "Pass@5" rate than the "SFT prior" model across all observed steps.
* Both models exhibit fluctuations in their pass rates, suggesting that performance is not consistently improving or declining.
* The "SFT prior" model shows a more pronounced initial increase in pass rate, but its performance plateaus and fluctuates more significantly than the "RL prior" model.
* The "RL prior" model demonstrates a more stable and generally higher performance level.
### Interpretation
The data suggests that the "RL prior" model is more effective at achieving a higher pass rate than the "SFT prior" model, as measured by "Pass@5". The fluctuations in both lines indicate that the training process is not perfectly smooth and may be sensitive to variations in the data or training parameters. The initial rapid improvement of the "SFT prior" model could be due to quickly learning basic patterns, while the more stable performance of the "RL prior" model suggests a more robust learning process. The "Pass@5" metric likely refers to the percentage of times the model passes a specific test or evaluation criteria within the top 5 attempts, indicating a measure of success or accuracy. The difference in performance between the two models could be attributed to the different training methodologies employed (SFT vs. RL). Further investigation would be needed to understand the specific reasons for these differences and to optimize the performance of both models.