## Line Chart: Pass Rate (%) vs. Steps for SFT and RL Priors
### Overview
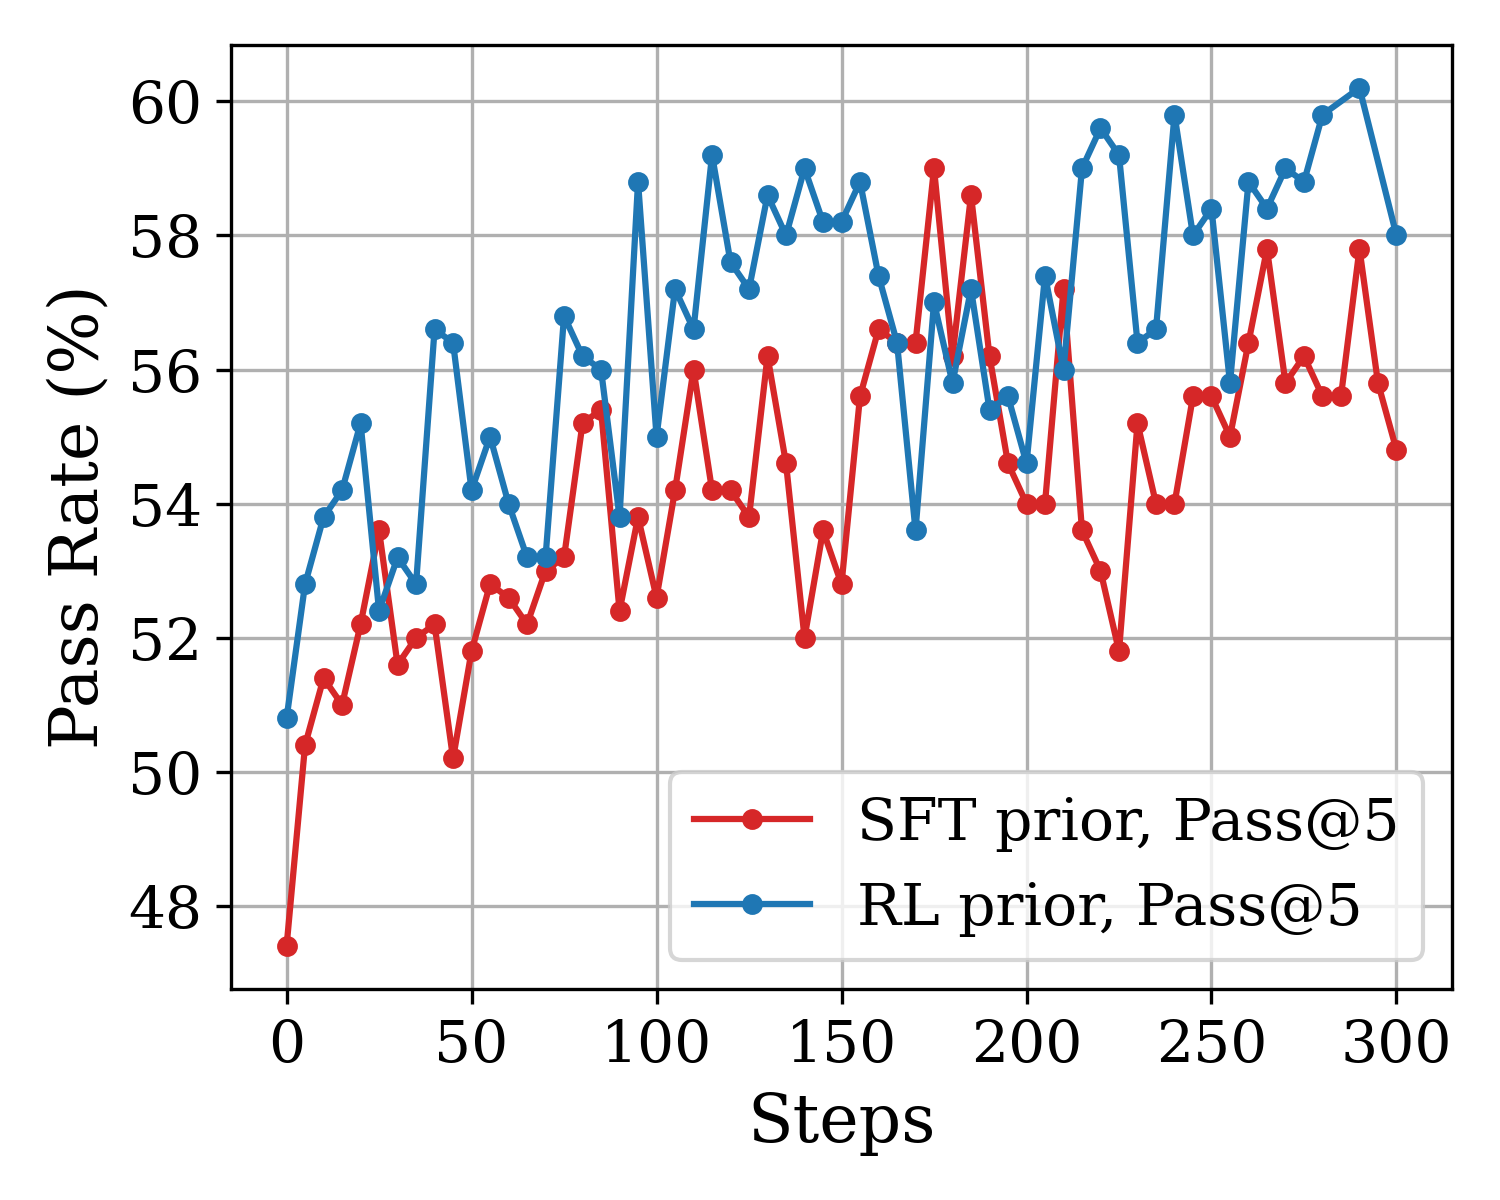
The image is a line chart comparing the performance of two different prior methods—SFT (Supervised Fine-Tuning) and RL (Reinforcement Learning)—over the course of 300 training steps. The performance metric is "Pass Rate (%)", measured using a "Pass@5" evaluation. The chart shows that both methods improve over time, but the RL prior generally achieves a higher pass rate with greater volatility.
### Components/Axes
* **Chart Type:** Line chart with markers.
* **X-Axis:**
* **Label:** "Steps"
* **Scale:** Linear, from 0 to 300.
* **Major Ticks:** 0, 50, 100, 150, 200, 250, 300.
* **Y-Axis:**
* **Label:** "Pass Rate (%)"
* **Scale:** Linear, from 48 to 60.
* **Major Ticks:** 48, 50, 52, 54, 56, 58, 60.
* **Legend:**
* **Position:** Bottom-right corner of the plot area.
* **Entry 1:** Red line with circular markers, labeled "SFT prior, Pass@5".
* **Entry 2:** Blue line with circular markers, labeled "RL prior, Pass@5".
* **Grid:** Light gray grid lines are present for both major x and y ticks.
### Detailed Analysis
**1. SFT prior, Pass@5 (Red Line):**
* **Trend:** Shows a general upward trend from step 0 to step 300, but with significant high-frequency volatility (sharp peaks and troughs).
* **Key Data Points (Approximate):**
* Starts at ~47.5% at step 0.
* Initial rapid rise to ~51.5% by step ~25.
* Experiences a notable dip to ~50.2% around step 50.
* Reaches a local peak of ~56.2% near step 125.
* Hits its highest point of ~59.0% around step 175.
* Shows a significant drop to ~51.8% near step 225.
* Ends at approximately 54.8% at step 300.
* **Volatility:** The line frequently changes direction, with swings of 2-4 percentage points between consecutive data points.
**2. RL prior, Pass@5 (Blue Line):**
* **Trend:** Also shows a clear upward trend, starting higher than the SFT line and generally maintaining a performance advantage. It exhibits even greater volatility, especially in the later stages.
* **Key Data Points (Approximate):**
* Starts at ~50.8% at step 0.
* Rises sharply to ~55.2% by step ~25.
* Reaches a high of ~56.6% around step 50.
* Shows a deep trough at ~53.2% near step 75.
* Surges to a peak of ~59.2% around step 125.
* Experiences a sharp drop to ~53.6% near step 175.
* Achieves its maximum value of ~60.2% at approximately step 290.
* Ends at ~58.0% at step 300.
* **Volatility:** The blue line's fluctuations are often larger in magnitude than the red line's, particularly after step 150.
### Key Observations
1. **Performance Gap:** The RL prior (blue) consistently outperforms the SFT prior (red) for the majority of the training steps shown. The gap is smallest at the very beginning and around step 175, where the red line briefly peaks.
2. **Volatility Comparison:** Both methods are highly volatile, but the RL prior's performance swings are more extreme, suggesting less stable but potentially higher-ceiling optimization.
3. **Late-Stage Performance:** After step 250, the RL prior shows a strong upward surge, reaching the highest recorded value on the chart (~60.2%), while the SFT prior's performance stagnates and then declines.
4. **Correlation of Dips:** There are points where both lines dip simultaneously (e.g., around step 75 and step 175), which might indicate challenging phases in the training process or evaluation batches.
### Interpretation
This chart demonstrates the comparative learning dynamics of two model training approaches. The **RL prior** appears to be a more powerful but less stable method for improving the pass rate on the given task. Its ability to reach higher peaks suggests it can find better solutions, but its greater volatility implies the training process is more sensitive or explores a wider, riskier space of parameters.
The **SFT prior** provides a more stable, though generally lower, performance trajectory. Its significant dip around step 225, from which it doesn't fully recover, could indicate overfitting or a failure mode in the supervised fine-tuning process at that stage.
The simultaneous dips in both curves are particularly interesting, as they suggest the underlying evaluation data or task difficulty may have inherent variations that affect both models similarly, regardless of their training prior. The final 50 steps highlight a key divergence: the RL method capitalizes on late training to achieve a new high, while the SFT method falters. This could imply that RL-based optimization benefits from longer training horizons for this specific problem.