# Technical Document Extraction: Line Chart Analysis
## 1. Labels and Axis Titles
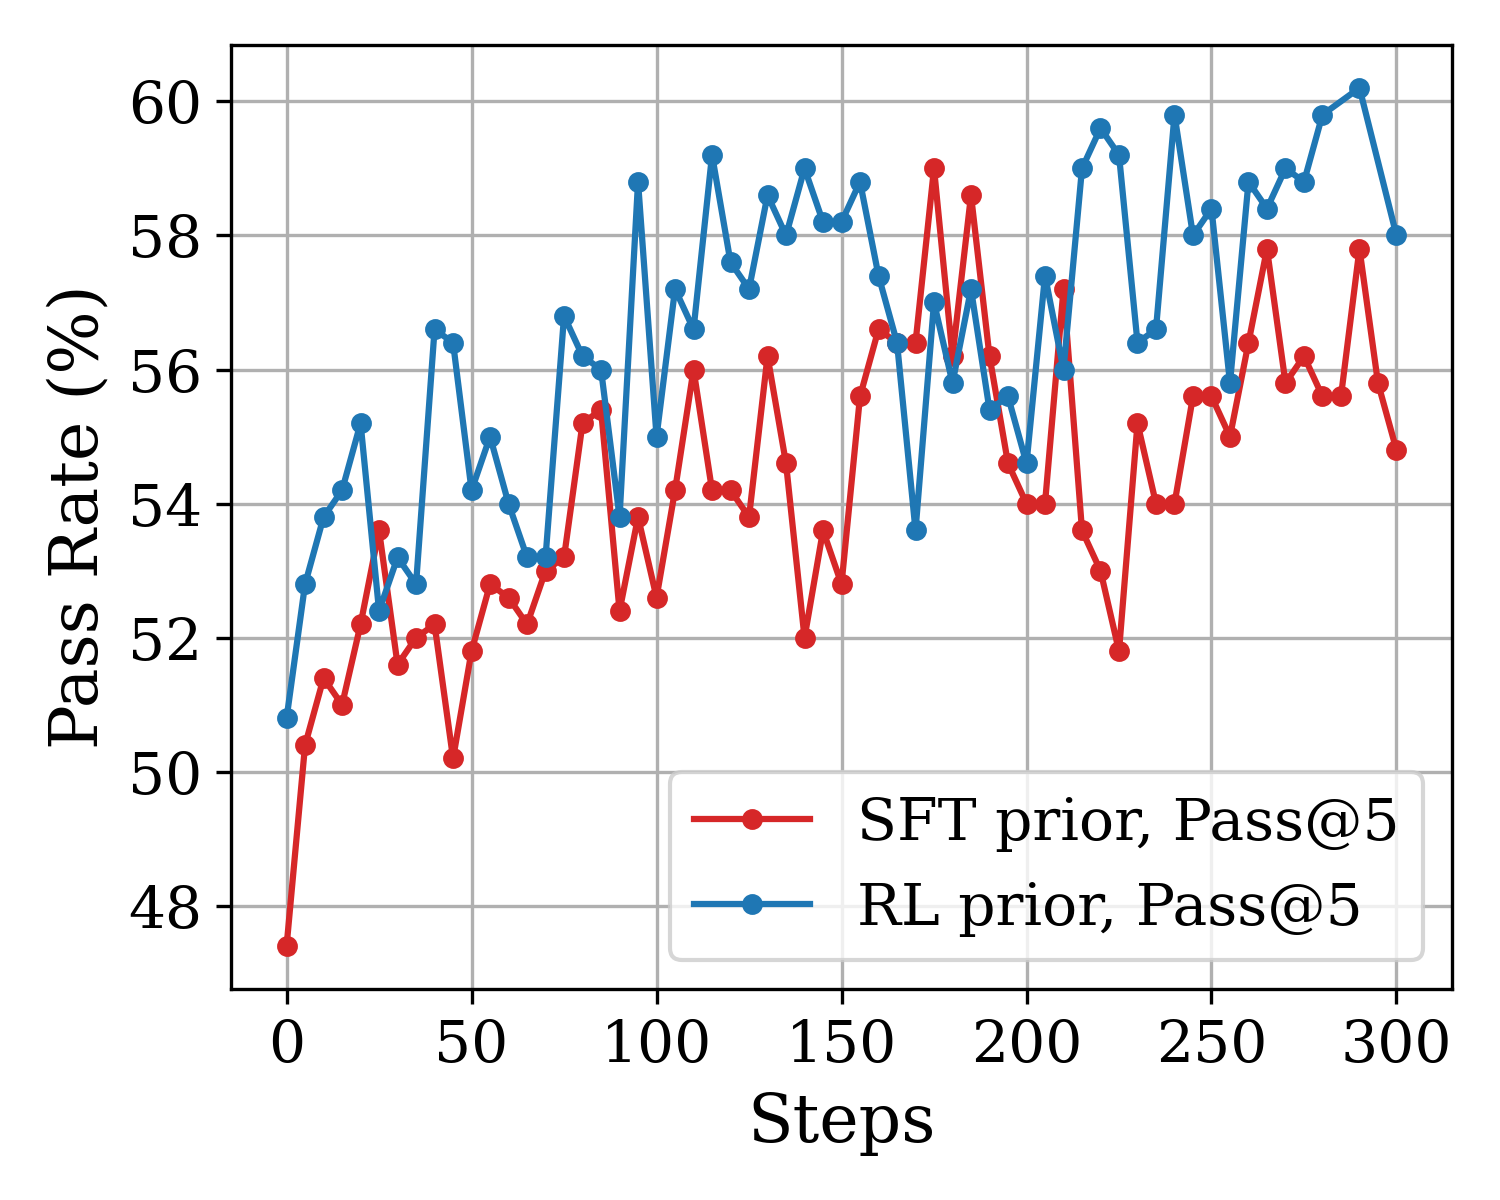
- **X-Axis**: Labeled "Steps" with numerical markers at intervals of 50 (0, 50, 100, 150, 200, 250, 300).
- **Y-Axis**: Labeled "Pass Rate (%)" with numerical markers at intervals of 2 (48, 50, 52, 54, 56, 58, 60).
## 2. Legend
- **Location**: Bottom-right corner of the chart.
- **Entries**:
- **Red Line**: "SFT prior, Pass@5"
- **Blue Line**: "RL prior, Pass@5"
## 3. Data Series and Trends
### Red Line (SFT prior, Pass@5)
- **Initial Value**: Starts at 48% at Step 0.
- **Trend**: Gradual upward trajectory with minor fluctuations.
- **Key Points**:
- Reaches ~55% by Step 300.
- Notable dips (e.g., ~50% at Step 50, ~52% at Step 150).
- Final value: ~55% at Step 300.
### Blue Line (RL prior, Pass@5)
- **Initial Value**: Starts at 51% at Step 0.
- **Trend**: Steeper upward trajectory with pronounced volatility.
- **Key Points**:
- Peaks at ~60% near Step 250.
- Dips to ~54% at Step 100 and ~55% at Step 200.
- Final value: ~58% at Step 300.
## 4. Spatial Grounding
- **Legend Placement**: Bottom-right corner (coordinates: [x=250, y=0] relative to the chart grid).
- **Color Consistency**:
- Red data points match "SFT prior, Pass@5".
- Blue data points match "RL prior, Pass@5".
## 5. Component Isolation
- **Main Chart**: Line graph with two overlapping data series.
- **No Additional Components**: No headers, footers, or secondary diagrams present.
## 6. Textual Information
- **No Embedded Text**: No annotations or text blocks within the chart.
- **No Data Table**: Chart relies solely on plotted lines and markers.
## 7. Summary
The chart compares the performance of two algorithms ("SFT prior" and "RL prior") over 300 steps, measured by "Pass@5" pass rate. The RL prior (blue) demonstrates higher variability but achieves a higher final pass rate (~58%) compared to the SFT prior (red), which shows a steadier but slower improvement (~55%).