# Technical Document Extraction: Heatmap Analysis
## Image Description
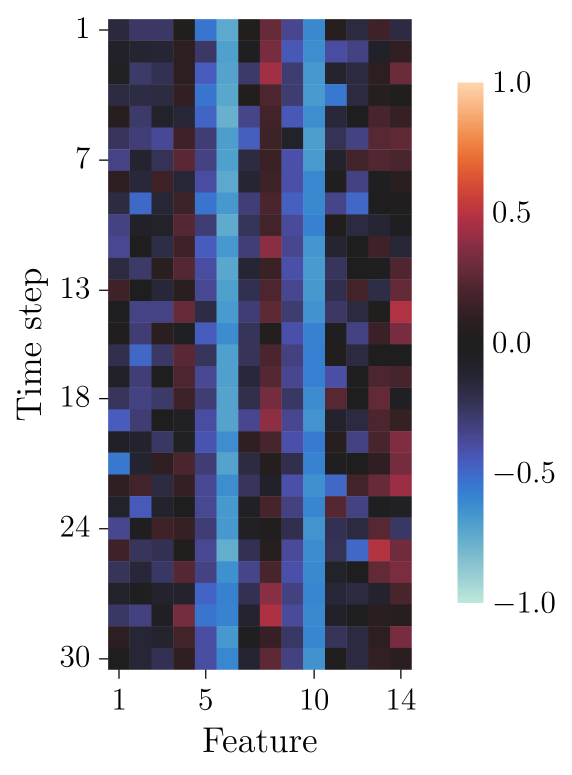
The image is a **heatmap** visualizing data across two dimensions: **Time step** (y-axis) and **Feature** (x-axis). The color intensity represents numerical values, with a gradient scale from **-1.0 (dark blue)** to **1.0 (yellow)**. The heatmap is divided into discrete grid cells, each colored based on its value.
---
## Axis Labels and Markers
- **Y-axis (Time step)**:
- Labels: `1`, `7`, `13`, `18`, `24`, `30`
- Units: "Time step" (no explicit unit provided).
- **X-axis (Feature)**:
- Labels: `1`, `5`, `10`, `14`
- Units: "Feature" (no explicit unit provided).
---
## Legend and Color Scale
- **Legend**:
- Located on the **right side** of the heatmap.
- Color gradient:
- **Dark blue** → **-1.0**
- **Black** → **0.0**
- **Red** → **0.5**
- **Yellow** → **1.0**
- Spatial grounding: The legend is positioned at the **right edge** of the heatmap, with colors transitioning vertically from bottom (dark blue) to top (yellow).
---
## Data Categories and Sub-Categories
- **Features (X-axis)**:
- `1`, `5`, `10`, `14` (no sub-categories).
- **Time steps (Y-axis)**:
- `1`, `7`, `13`, `18`, `24`, `30` (no sub-categories).
---
## Key Trends and Data Points
1. **Feature 5**:
- **Trend**: Vertical stripe of **dark blue** (values near **-1.0**) across all time steps.
- **Interpretation**: Consistently low values for Feature 5.
2. **Feature 10**:
- **Trend**: Vertical stripe of **red** (values near **0.5**) across all time steps.
- **Interpretation**: Moderately high values for Feature 10.
3. **Feature 14**:
- **Trend**: Vertical stripe of **red** (values near **0.5**) across all time steps.
- **Interpretation**: Moderately high values for Feature 14.
4. **Other Features (1, 7, 13, 18, 24, 30)**:
- **Trend**: Mixed colors (blue, black, red) with no consistent pattern.
- **Interpretation**: Values vary significantly across time steps.
---
## Spatial Grounding and Color Verification
- **Legend Position**: Right side of the heatmap.
- **Color Matching**:
- Dark blue cells (e.g., Feature 5) align with **-1.0**.
- Red cells (e.g., Features 10 and 14) align with **0.5**.
- Yellow cells (none observed) would align with **1.0**.
---
## Component Isolation
- **Main Chart**:
- Heatmap grid with time steps (y-axis) and features (x-axis).
- **Legend**:
- Right-aligned color gradient.
- **No Header/Footer**: No additional text or annotations outside the heatmap.
---
## Notes
- The image contains **no explicit textual data** beyond axis labels and legend.
- The heatmap represents a **numerical dataset** with no explicit units for "Time step" or "Feature."
- No other languages are present in the image.