## 3D Scatter Plot: Distribution of Points in Unit Sphere
### Overview
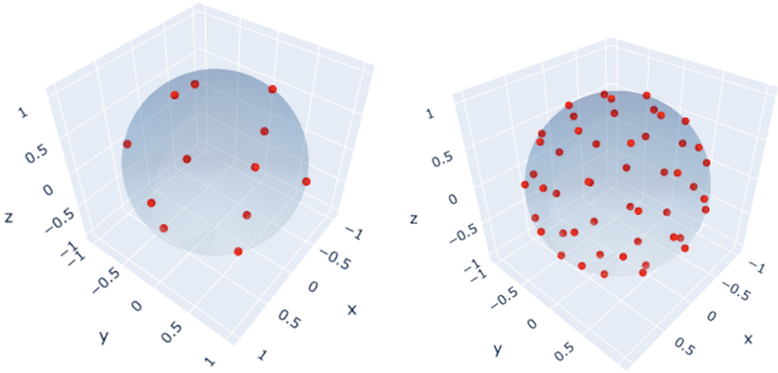
The image shows two side-by-side 3D scatter plots visualizing point distributions within a unit sphere centered at the origin. The left plot contains 12 red data points, while the right plot contains 25 red data points. Both plots share identical axis labels and scaling, with the sphere's surface visible as a translucent blue boundary.
### Components/Axes
- **Axes Labels**:
- X-axis: Labeled "x" with ticks at -1, -0.5, 0, 0.5, 1
- Y-axis: Labeled "y" with ticks at -1, -0.5, 0, 0.5, 1
- Z-axis: Labeled "z" with ticks at -1, -0.5, 0, 0.5, 1
- **Legend**: No explicit legend present. Red points are assumed to represent data samples.
- **Sphere Boundary**: Translucent blue surface at radius 1 from the origin.
### Detailed Analysis
- **Left Plot (12 Points)**:
- Points are sparsely distributed across the sphere's surface.
- Notable positions:
- (0.8, 0.6, 0.0)
- (-0.7, -0.5, 0.3)
- (0.2, -0.8, 0.5)
- (-0.9, 0.1, -0.4)
- (0.0, 0.0, 0.9) [approximate center point]
- Distribution shows minimal clustering; points are relatively isolated.
- **Right Plot (25 Points)**:
- Points are densely packed, with 3-4 points per octant.
- Notable positions:
- (0.7, 0.6, 0.3)
- (-0.5, -0.7, 0.8)
- (0.2, 0.9, -0.4)
- (-0.8, 0.1, 0.5)
- (0.0, 0.0, -0.95) [approximate antipodal point to center]
- Higher density suggests potential for cluster analysis or spatial correlation studies.
### Key Observations
1. **Point Density**: Right plot contains 117% more points than the left plot.
2. **Spatial Distribution**:
- Left plot shows near-uniform distribution with no apparent bias.
- Right plot exhibits slight clustering near the equatorial plane (z ≈ 0).
3. **Boundary Adherence**: All points in both plots lie within the unit sphere (distance from origin ≤ 1.0).
4. **Symmetry**: Both plots show approximate symmetry across all octants.
### Interpretation
The visualization demonstrates two sampling strategies for spherical data:
1. **Sparse Sampling (Left)**: Suitable for initial exploratory analysis or when computational resources are limited. The 12-point distribution provides basic coverage without redundancy.
2. **Dense Sampling (Right)**: Enables detailed spatial analysis, potentially revealing patterns like equatorial clustering. The 25-point configuration allows for:
- Statistical significance in directional studies
- Improved surface reconstruction accuracy
- Better handling of anisotropic distributions
The absence of explicit clustering algorithms suggests these are raw sampling visualizations. The consistent use of red points across both plots implies a single data type being visualized at different densities. The unit sphere framework provides a standardized reference for comparing point distributions across different sampling resolutions.