## Legend: Best separability for N_OR = 3
### Overview
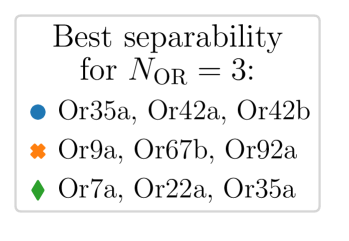
The image is a legend or key for a chart, titled "Best separability for N_OR = 3". It categorizes data points into three groups using distinct symbols and colors, each associated with specific OR codes. The legend is positioned at the top of the image, enclosed in a light gray box with rounded corners.
### Components/Axes
- **Title**: "Best separability for N_OR = 3" (centered at the top).
- **Legend Structure**:
- **Blue Circles**: Labeled "Or35a, Or42a, Or42b".
- **Orange Crosses**: Labeled "Or9a, Or67b, Or92a".
- **Green Diamonds**: Labeled "Or7a, Or22a, Or35a".
- **Symbol Placement**: Symbols (blue circle, orange cross, green diamond) are aligned vertically on the left side of the legend, with corresponding OR code lists to their right.
### Detailed Analysis
- **Blue Group**: Contains three OR codes: Or35a, Or42a, Or42b.
- **Orange Group**: Contains three OR codes: Or9a, Or67b, Or92a.
- **Green Group**: Contains three OR codes: Or7a, Or22a, Or35a.
- **Overlap**: The OR code "Or35a" appears in both the blue and green groups, suggesting it may belong to multiple optimal separability configurations.
### Key Observations
1. Each group (blue, orange, green) has exactly three OR codes.
2. The OR code "Or35a" is shared between the blue and green groups, indicating potential dual applicability.
3. No numerical values or trends are present, as this is a categorical legend.
### Interpretation
The legend defines three distinct groupings of OR codes that achieve the "best separability" when N_OR = 3. The shared OR code "Or35a" across two groups implies it may be a critical or versatile identifier in multiple optimal configurations. The categorization likely reflects different criteria or conditions under which these OR codes maximize separability. This structure aids in selecting appropriate OR codes for analysis based on the desired separability outcome.