\n
## Diagram: Network Structures
### Overview
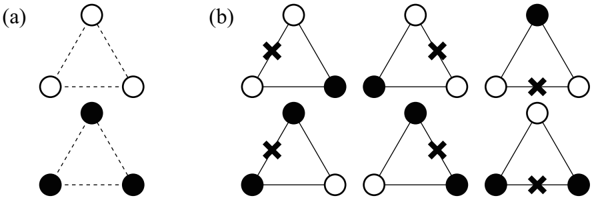
The image presents two diagrams, labeled (a) and (b), depicting network structures composed of nodes and edges. Diagram (a) shows a single triangular network, while diagram (b) displays a repeating pattern of triangular networks connected to form a larger structure. Nodes are represented by circles, with some circles filled in black. Some nodes in diagram (b) are marked with an 'x'.
### Components/Axes
There are no explicit axes or scales. The diagrams are purely structural representations. The components are:
* **Nodes:** Represented by circles.
* **Edges:** Represented by lines connecting the nodes.
* **Node Color:** White or Black.
* **Node Marker:** 'x' (present only in diagram b).
### Detailed Analysis or Content Details
**Diagram (a):**
* The diagram consists of six nodes arranged in a triangular pattern.
* Three nodes are white circles, positioned at the vertices of an equilateral triangle.
* Three nodes are black circles, positioned similarly to the white circles, forming a second triangle offset from the first.
* Dashed lines connect each white node to its nearest black node, forming the edges of the network.
**Diagram (b):**
* The diagram consists of multiple triangular networks arranged in a repeating pattern.
* Each triangular network is composed of three white circles and three black circles, similar to diagram (a).
* Nodes are connected by solid lines.
* Several nodes are marked with an 'x'. These 'x' marked nodes are all white circles.
* The pattern appears to be a tessellation of triangular networks.
* The arrangement is roughly rectangular, with approximately 16 nodes visible.
* The 'x' markers appear to be placed on nodes that are not directly connected to other nodes within the immediate triangular structure.
### Key Observations
* Diagram (b) builds upon the structure of diagram (a), extending it into a larger, repeating network.
* The black and white nodes in both diagrams appear to alternate in position.
* The 'x' markers in diagram (b) highlight specific nodes within the network, potentially indicating a different status or role.
* The dashed lines in diagram (a) versus the solid lines in diagram (b) suggest a difference in the type or strength of connection.
### Interpretation
The diagrams likely represent abstract networks or relationships. The use of different node colors (black and white) could signify different types of entities or states. The 'x' markers in diagram (b) might indicate nodes that are isolated or have a specific function within the network. The change from dashed lines in (a) to solid lines in (b) could represent a strengthening or formalization of connections.
The diagrams could be used to model various systems, such as:
* **Social networks:** Nodes representing individuals, edges representing relationships.
* **Communication networks:** Nodes representing devices, edges representing communication links.
* **Biological networks:** Nodes representing genes or proteins, edges representing interactions.
* **Abstract mathematical structures:** Representing graphs or lattices.
Without further context, it is difficult to determine the precise meaning of the diagrams. However, the visual structure suggests a focus on connectivity, relationships, and potentially, the identification of key nodes or patterns within the network. The diagrams are not providing quantitative data, but rather a qualitative representation of network structure.